This blog post is part of Udacity Data Scientists Nanodegree Program.
Detailed analysis with all required code is posted in https://github.com/NTN-hacker/Write-a-Data-Science-Blog-Post

Overall
We will talk about the variables that impact the GoBike system in this post, and by doing so, we will be able to determine what has to be improved in order to draw in more users.
The data including information of 183.412 ford gobike trips in San Francisco area with 16 variables (duration_sec, start_time, end_time, start_station_id, start_station_name, start_station_latitude, start_station_longitude, end_station_id, end_station_name, end_station_latitude ,end_station_longitude, bike_id, user_type, member_birth_year, member_gender, bike_share_for_all_trip). But some data have wrong so it needs to be clean them.
1. How age of rider distributed?
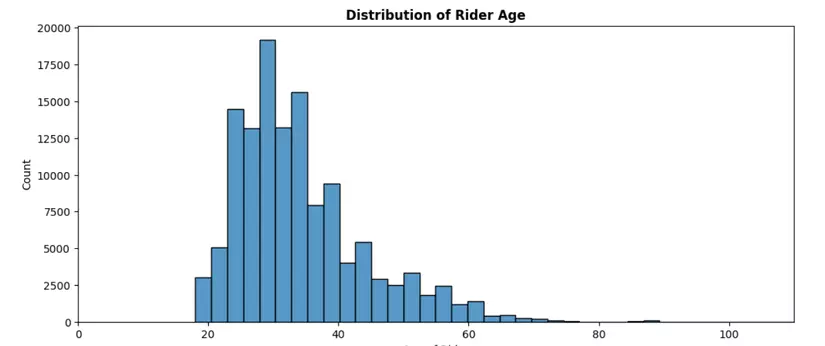
Individuals aged 20 to 45 make up the majority of participants. Furthermore, out of the three gender groupings, the majority of bike riders are men.
2. What are percentage of User Type and Member Gender?
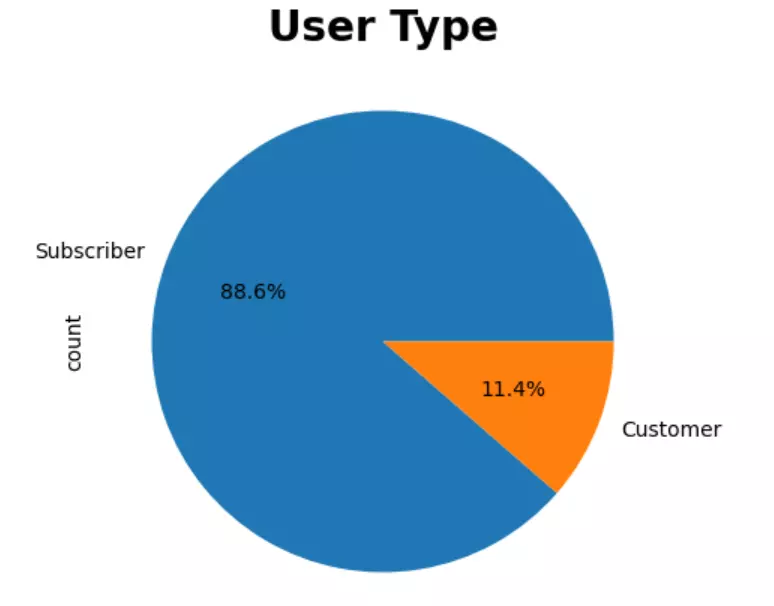
A huge amount of people have signed up for subscriptions.
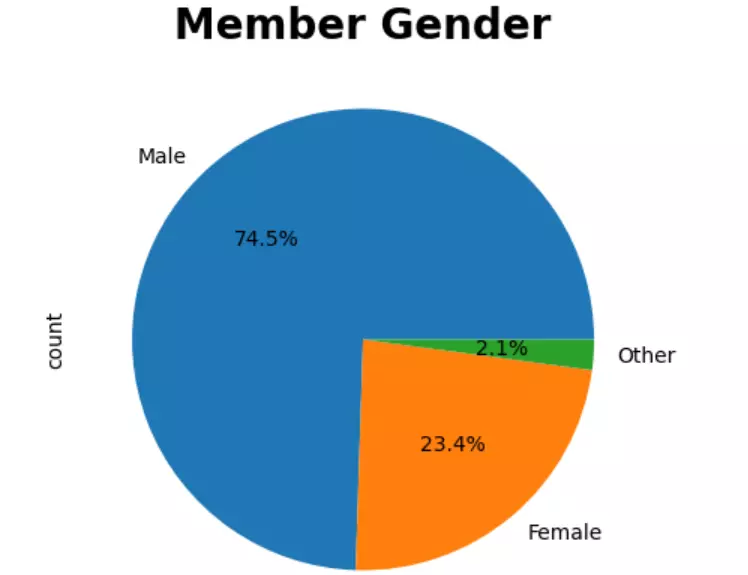
There are more Male members than Female members. There are more women than Other.
3. Is there any relationship between duration second and user type?
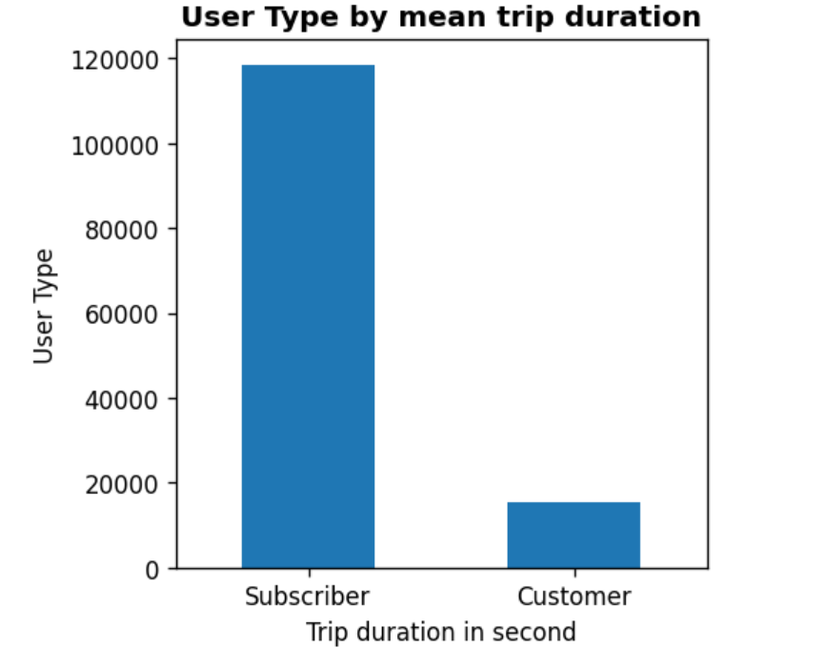
Although the number of Subscriber user is more than number of Customer, Customer trip duration is more than Subscriber
4. Is there any relationship between duration second, gender and user type?
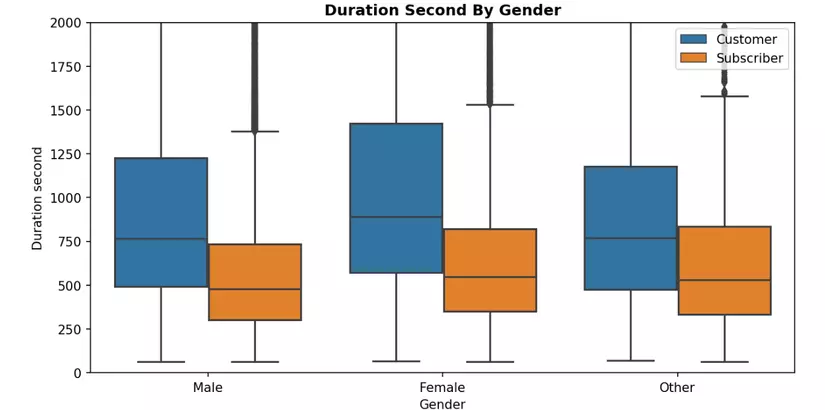
Subscriber have less trip than Customer beside that Male is less than Female also.
5. Is there any relationship between duration second, week day and user type?
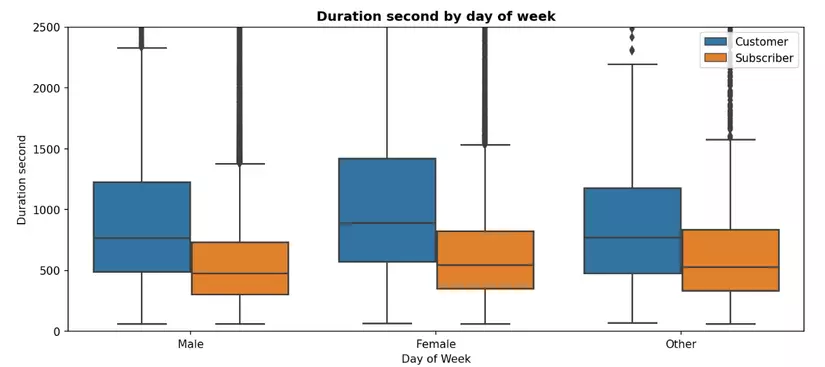
It seems that more trip in weekend than day week for Customer and for Subscriber it the same for all week.
6. What is top 10 Start and End Station have most rider?
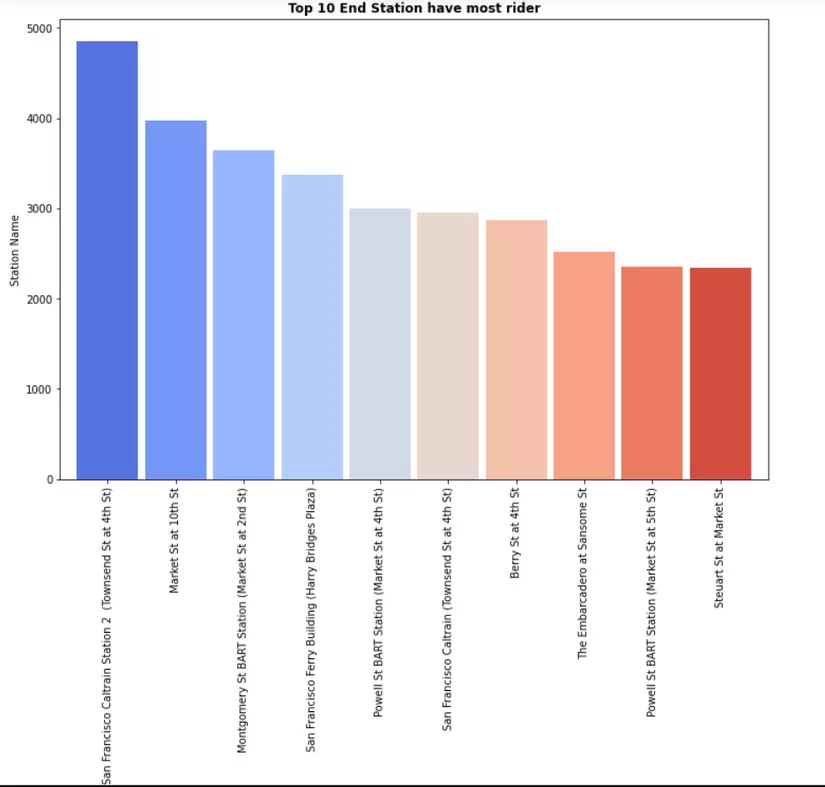
The previous graphic shows that when riders begin to ride, Market St. near 10th St. has the greatest number of riders. However, this is not the finish station. It's a San Francisco Caltrain Station 2 since there may be a lot of lovely places and well-known restaurants nearby.
Conclusions
The previous graphic shows that when riders begin to ride, Market St. near 10th St. has the greatest number of riders. However, this is not the finish station. It's a San Francisco Caltrain Station 2 since there may be a lot of lovely places and well-known restaurants nearby.
My privacy information
If any problem is unclear, you could response for me via my email: nguyennhan8521@gmail.com Thank you.