Introduction
One of the important issues after releasing environmental software products is detecting unexpected exception errors, early warning to relevant teams to fix operational problems to ensure quality. service quality and avoid downtime. Grafana was created to help us operate the service smoothly and evaluate possible problems such as: unusually high request volume, Out of Memory, full disk. disk. Or even the request rate in regions around the world.
What it's Grafana
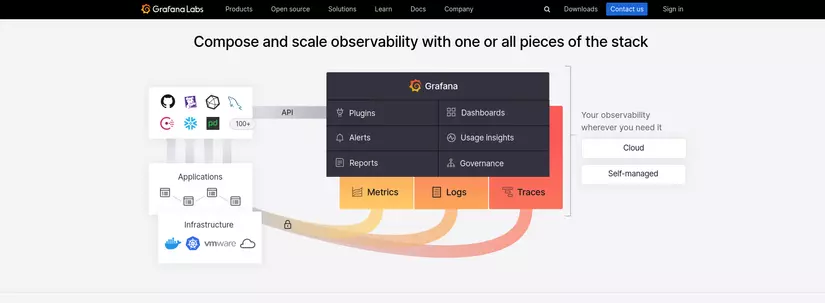
Grafana open-source software enables you to query, visualize, alert on, and explore your metrics, logs, and traces wherever they are stored. Grafana OSS provides you with tools to turn your time-series database (TSDB) data into insightful graphs and visualizations. Grafana provides convenient integration of up to 153 connectable data sources. In this tutorial, I will provide a detailed overview of how to set up, use, and optimize your dashboards.
Install Grafana
In this tutorial, I will deploy Grafana and use Helm Chart quickly. Because my current job is related to DevOps, I will use Helm. You can use Docker Images or deploy on K8S.
Requirement
Before installation, we must meet the following tools:
- Install a Kubernetes server on your machine.
- Install the latest stable version of Helm.
- Install the latest version of Istio mesh
Install Grafana using Helm
When you install Grafana using Helm, you complete the following tasks:
- Set up the Grafana Helm repository, which provides a space in which you will install Grafana.
- Deploy Grafana using Helm, which installs Grafana into a namespace.
- Accessing Grafana, which provides steps to sign into Grafana.
Set up the Grafana Helm repository
- Add the repository using the following command
helm repo add grafana https://grafana.github.io/helm-charts
2. Confirm the repository has been added successfully
helm repo list
3. Run the command to update the repository to download the latest Grafana Helm charts
helm repo update
Deploy the Grafana Helm charts
We can start to deploy it on your Kubernetes cluster. To easily manage resources, K8S uses namespaces. So we have to create a namespace. In the example I will use the namespace monitoring.
- To create a namespace, run the following command
kubectl create namespace monitoring - Run the following command to deploy the Grafana Helm Chart inside your namespace. Run the following command to deploy Helm Grafana Chart inside your namespace. Remember to add proper namespace monitoring. In case namespace is not declared, namespce will be used by default.
helm install grafana grafana/grafana -n monitoring
- Verify the deployment status
helm list -n monitoring Access Grafana
To access Grafana using a web browser, I will use a domain. To do this, I use Istio's virtual service file. Create a file named garafana-vs.yaml
apiVersion: networking.istio.io/v1beta1
kind: VirtualService
metadata: name: grafana namespace: monitoring
spec: hosts: - "grafana.monitoring.co" gateways: - monitoring-api-gateway http: - match: - uri: prefix: / route: - destination: host: grafana.monitoring.svc.cluster.local port: number: 3000
Explain code:
- I prepared a domain first called https://grafana.monitoring.co
- I use AWS Route53 and ALB service so this place can see me route traffic through the *monitoring-api-gateway *
- destination declaration section host: grafana is the service name, monitoring is namespace and the service's default port is 3000
Next step, use the command below to apply the configuration file above. Don't forget namespaces
kubectl apply <path/garafana-vs.yaml> -n monitoring
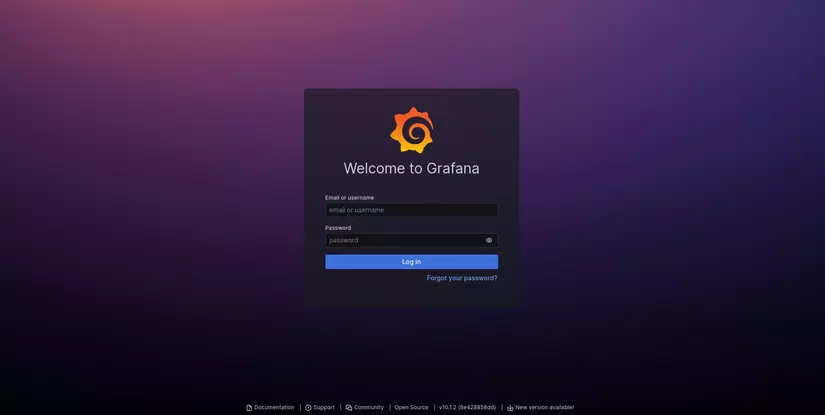
Accessing the web browser and see the results. The default account and password will be displayed when grafana is successfully installed. Use it and login.
Grafana's main interface
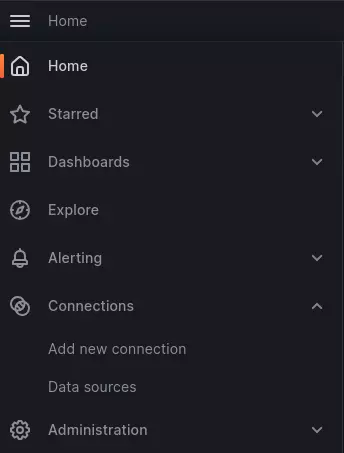
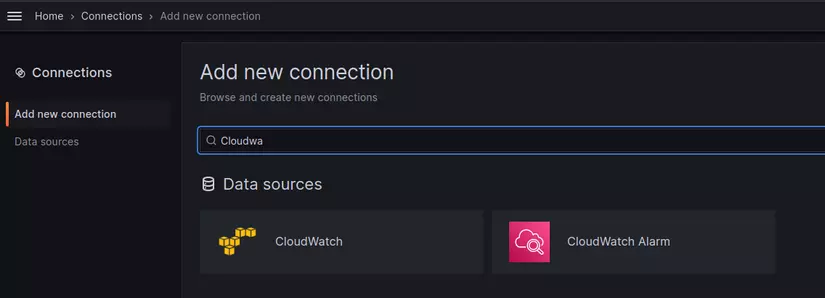
Open the drop-down menu below and select Connection --> Add new connection
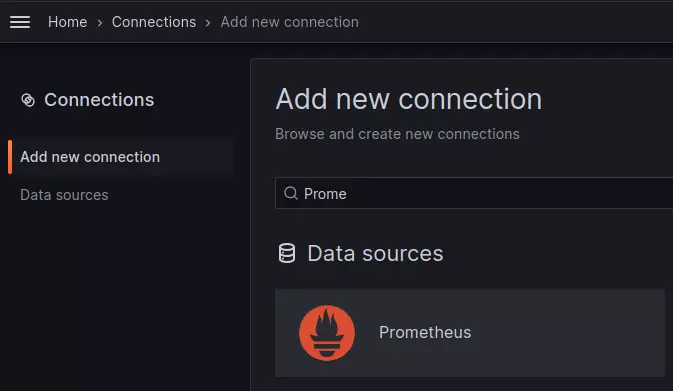
Grafana supports up to 153 data sources depending on your needs. Here I use data source Prometheus and AWS Cloudwatch
Configure additional endpoints and test connections

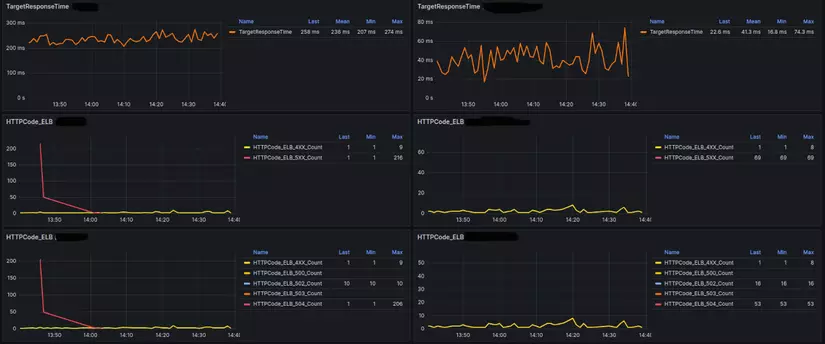
Finally, design dashboards according to user needs. This is an example of the amount of status code through the ALB that I built
No one has enough time to continuously monitor the dashboard 24/24. Grafana supports setting up alerts to services to proactively check services. For example, send alerts via email, slack, teams, discord,... . You just need to configure the threshold at which you think an error should occur, and let grafana alert do the rest. You can also reconfigure the alert you want to notify to be more intuitive and easier to grasp the main content.
Security
For any application, security is always the top priority. Sensitive data leaks are always of concern to security experts. In this article, I have some solutions to increase security to avoid data leaks.
Grafana organizes decentralization from high to low Organization --> Teams --> User .When creating a new user, appropriate permissions need to be assigned according to the Services that that user handles.
Some rules that need to be followed when Users use grafana:
- Do not assign admin rights to users, to the entire dashboard. Only have Viewer rights
- Dashboard cannot be placed outside the default folder
- You can use LDAP to login or add an Oauth2 security layer
- Use the strategy of dividing the powers of one user as small as possible.
END
In the next article, I will guide you through setting up the real-time healcheck service system. Thank you for reading the article and if you find it interesting, please follow it. If you have any questions that need answering, please leave a comment below.