
Monitoring là 1 topic không còn xa lạ và vẫn rất hot với chúng ta :v. Đặc biệt khi làm về monitoring thì chắc hầu như anh em sẽ nhớ tới bộ đôi thần thánh Prometheus và Grafana.
Hôm nay, mình sẽ demo setup bộ monitor này sử dụng docker và thêm phần logging sử dụng Loki (Cũng là 1 sản phẩm của GrafanaLabs). Loki: like Prometheus, but for logs. Intro của Loki :v đọc xong thấy vào việc luôn :v :v :v
Trong bài viết này mình sẽ thực hiện setup các thành phần như sau:
- Prometheus (metrics database):
http://<host-ip>:9090 - Prometheus-Pushgateway (push acceptor for ephemeral and batch jobs):
http://<host-ip>:9091 - AlertManager (alerts management):
http://<host-ip>:9093 - Grafana (visualize metrics):
http://<host-ip>:3000 - Loki (likes prometheus, but for logs):
http://<host-ip>:3100 - Promtail (is the agent, responsible for gathering logs and sending them to Loki)
- NodeExporter (host metrics collector)
- cAdvisor (containers metrics collector)
- Caddy (reverse proxy and basic auth provider for prometheus and alertmanager)
Source code mình để ở đây
Để tiện trong bài viết mình sẽ gọi phần demo này là domolo cho anh em dễ theo dõi nhé 😄 (domolo: docker - monitor -log) 😅😅😅.
Ok !!! Vào thôi
Setup
Đầu tiên, anh em tiến hành cài đặt docker trên máy mình nhé. Sau đấy, anh em clone source code về 😄:
git clone https://github.com/ductnn/domolo.git
cd domolo
docker-compose up -d
# À từ hẵng chạy ...
Cấu trúc của domolo trông như này:
.
├── alertmanager
│ └── config.yml
├── assets
├── caddy
│ └── Caddyfile
├── fake-logs
│ ├── Dockerfile
│ ├── README
│ └── entrypoint.sh
├── grafana
│ └── provisioning
│ ├── dashboards
│ │ ├── dashboard.yml
│ │ ├── docker_containers.json
│ │ ├── docker_host.json
│ │ ├── monitor_services.json
│ │ ├── nginx_container.json
│ │ └── node_exporter_full.json
│ └── datasources
│ └── datasource.yml
├── loki
│ ├── loki-config.yaml
│ └── promtail-config.yaml
├── prometheus
│ ├── alert.rules
│ └── prometheus.yml
├── config
├── docker-compose.agents.yml
├── docker-compose.with-flogs.yml
├── docker-compose.yml
Grafana
Trong Grafana mình sẽ setup 2 phần chính:
- Datasources
- Dashboards
Trước tiên, anh em chỉnh file config
để setup các biến user vs password theo ý mình nhé:
GF_SECURITY_ADMIN_USER=admin
GF_SECURITY_ADMIN_PASSWORD=changeme
GF_USERS_ALLOW_SIGN_UP=false
Trong phần datasources chúng ta sẽ config sẵn prometheus và loki:
apiVersion: 1 datasources: - name: Prometheus type: prometheus access: proxy orgId: 1 url: http://prometheus:9090 basicAuth: false isDefault: true editable: true - name: Loki type: loki access: proxy jsonData: maxLines: 1000 basicAuth: false url: http://loki:3100 isDefault: false editable: true
Việc này sẽ giúp chúng ta không cần phải add thêm 2 thằng này sau khi dựng cụm. Phần dashboards của Grafana mình sẽ trình bày ở dưới.
Prometheus + Node Exporter
Prometheus(metrics database): Có nhiệm vụ lấy thông tin metrics từ các target và lưu lại. Phần cấu hình chính của prometheus ở đây, các tham số chính mình sử dụng:
- global: Dùng để setup khoảng thời gian định kỳ prometheus pull metrics
về, và tham số
external_labelsđể có thể lấy thông tinmetricstừ các hệ thống bên ngoài về prometheus. - alerting: Thông tin kết nối tới Alert Manager.
- rule_files: Đây là phần quan trọng trong xử lý cảnh báo. Anh em có thể đặt ra các rules tuỳ theo nhu cầu đưa ra, ví dụ: các cảnh báo cao tải CPU hay RAM của hệ thống. Anh em có thể theo dõi 1 số rules mẫu ở đây
- scrape_configs: Kết nối tới các target để lấy
metric.
Giám sát trực tiếp hệ thống prometheus:
scrape_configs: - job_name: 'nodeexporter' scrape_interval: 5s static_configs: - targets: ['nodeexporter:9100']
Giám sát các hẹ thống khác:
external_labels: monitor: 'docker-host-alpha' scrape_configs: - job_name: 'ApiExporter' scrape_interval: 5s static_configs: - targets: ['<IP Server needed Monitor>:Port']
Node Exporter(host metrics collector): Có nhiệm vụ thu thập metrics từ
các servers. Ở đây, mình sẽ lấy thông tin metrics tại /proc, /sys:
volumes: - /proc:/host/proc:ro - /sys:/host/sys:ro - /:/rootfs:ro
Để setup node_exporter lên server cần giám sát anh em chạy file docker-compose.agents.yml
docker-compose -f docker-compose.agents.yml up -d
Ngoài ra, trong file docker-compose.agents.yml sẽ setup thêm cAdvisor (giống
như node_exporter nhưng khác là cAdvisor lấy metrics của containers), và
promtail mình sẽ trình bày phía dưới.
Grafana Dashboards
Phần này anh em có thể tự tạo ra dashboard phù hợp với nhu cầu của dự án, hoặc
có thể lên Grafana Dashboards để kiếm
template cho nhanh (lắm cái đẹp vl 😅😅😅)
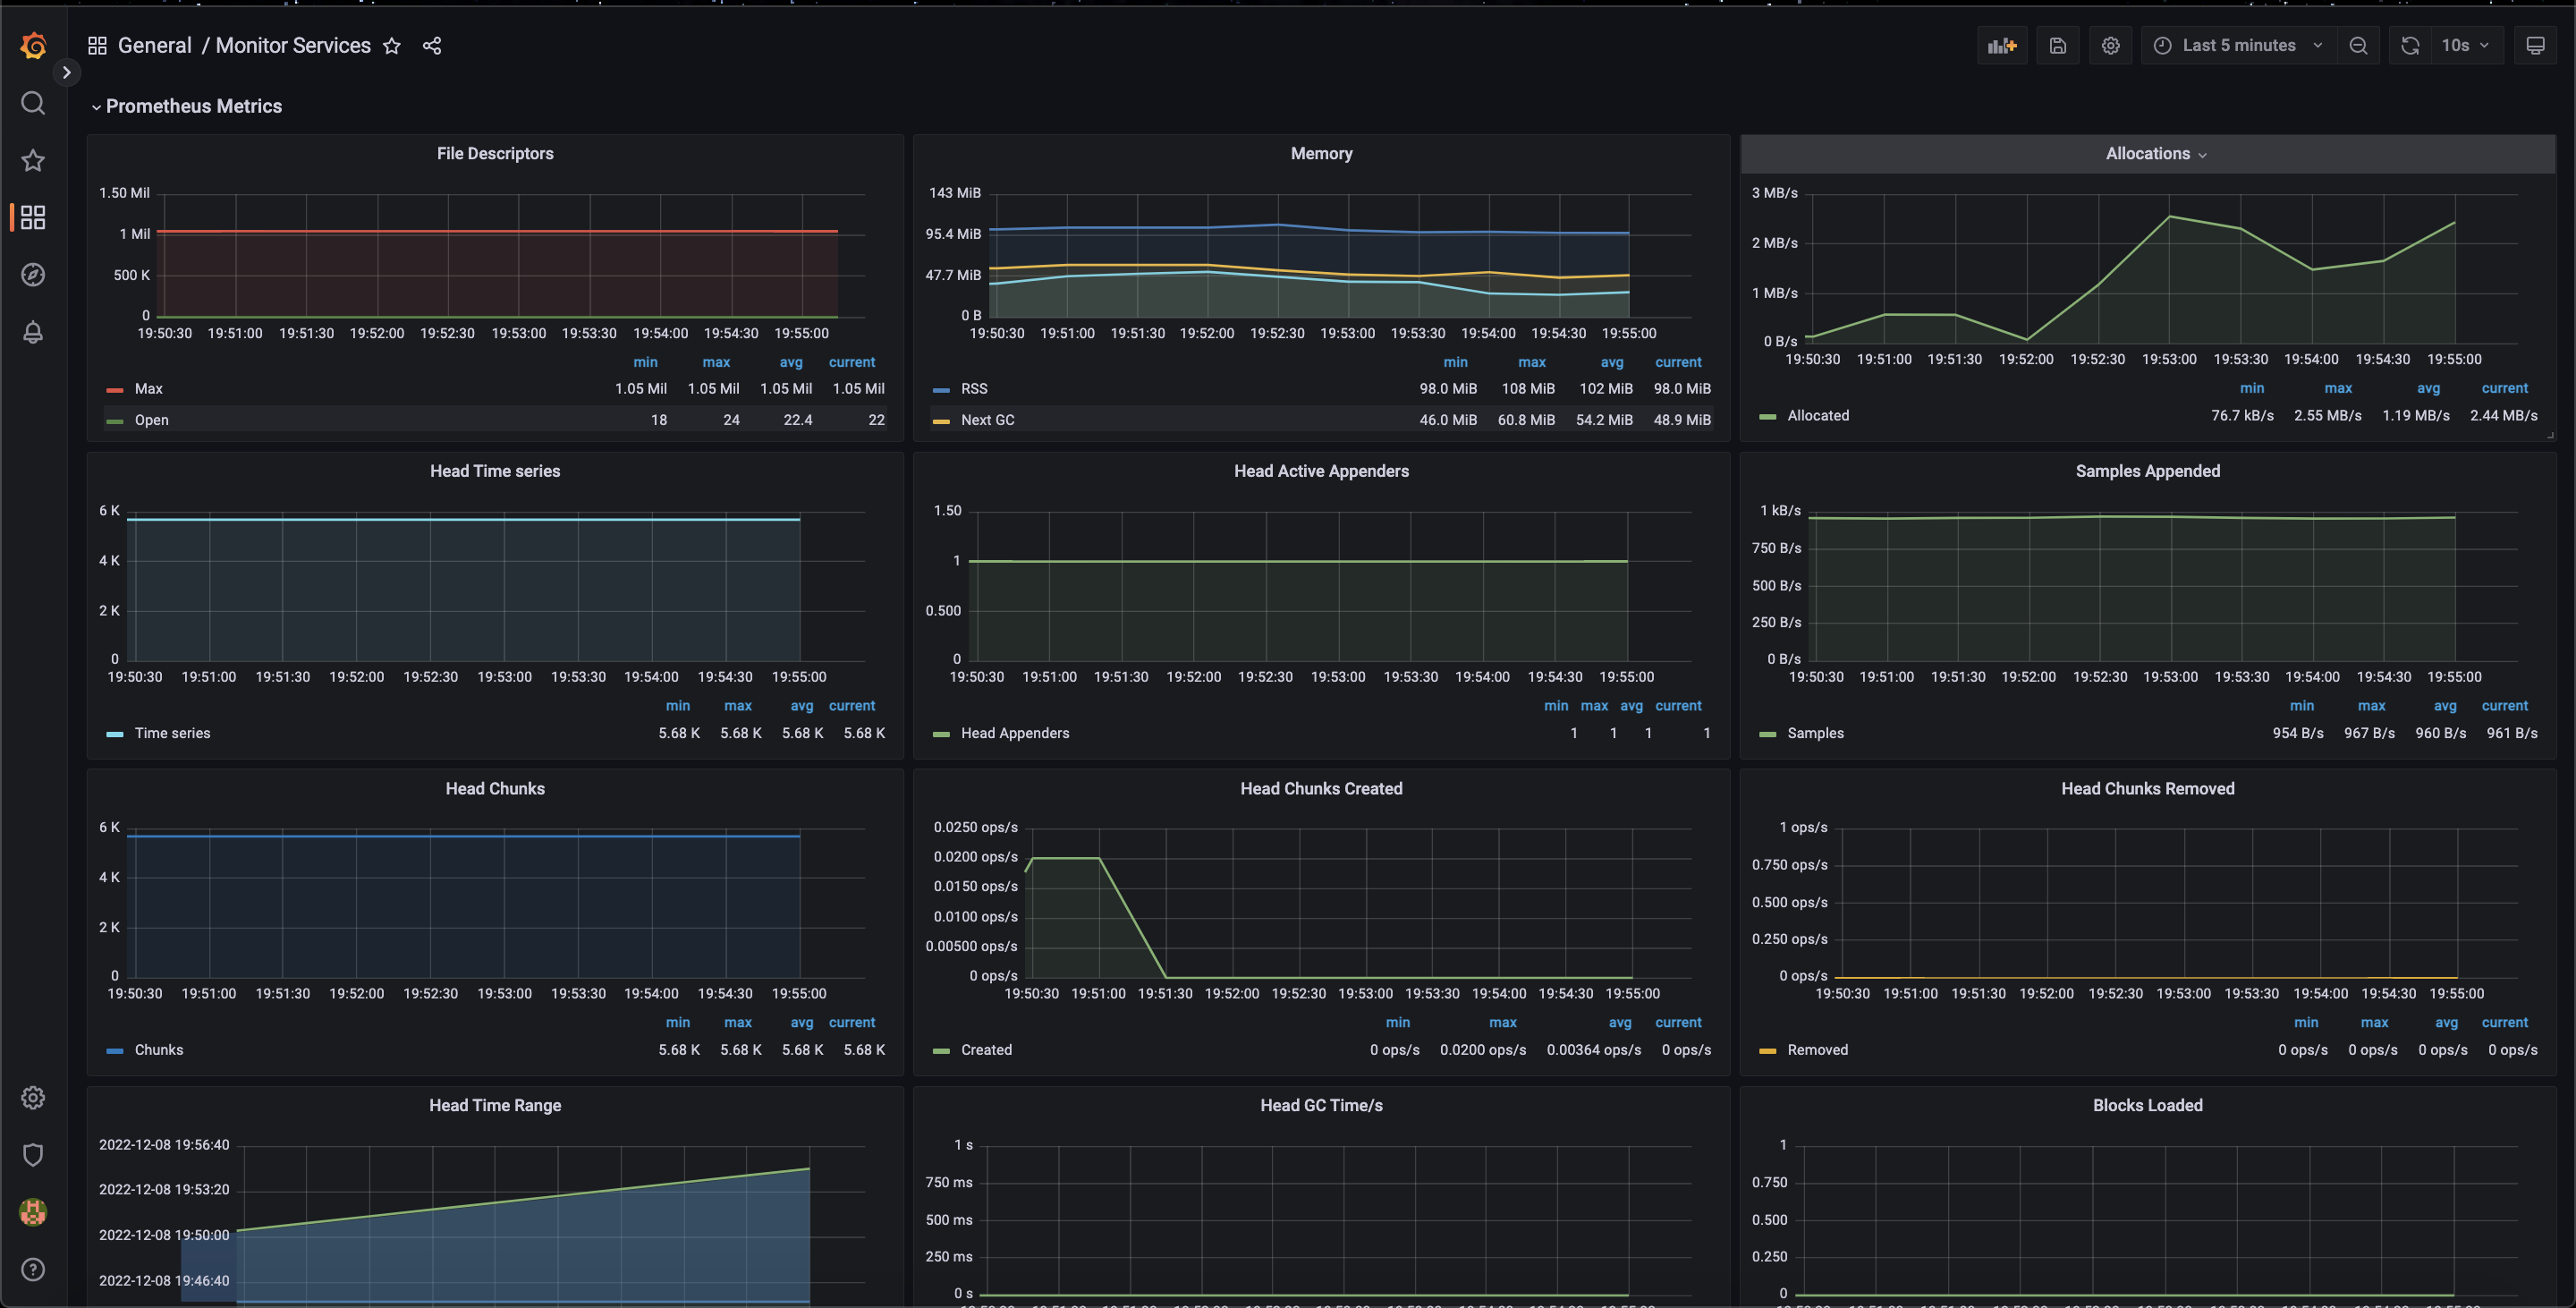
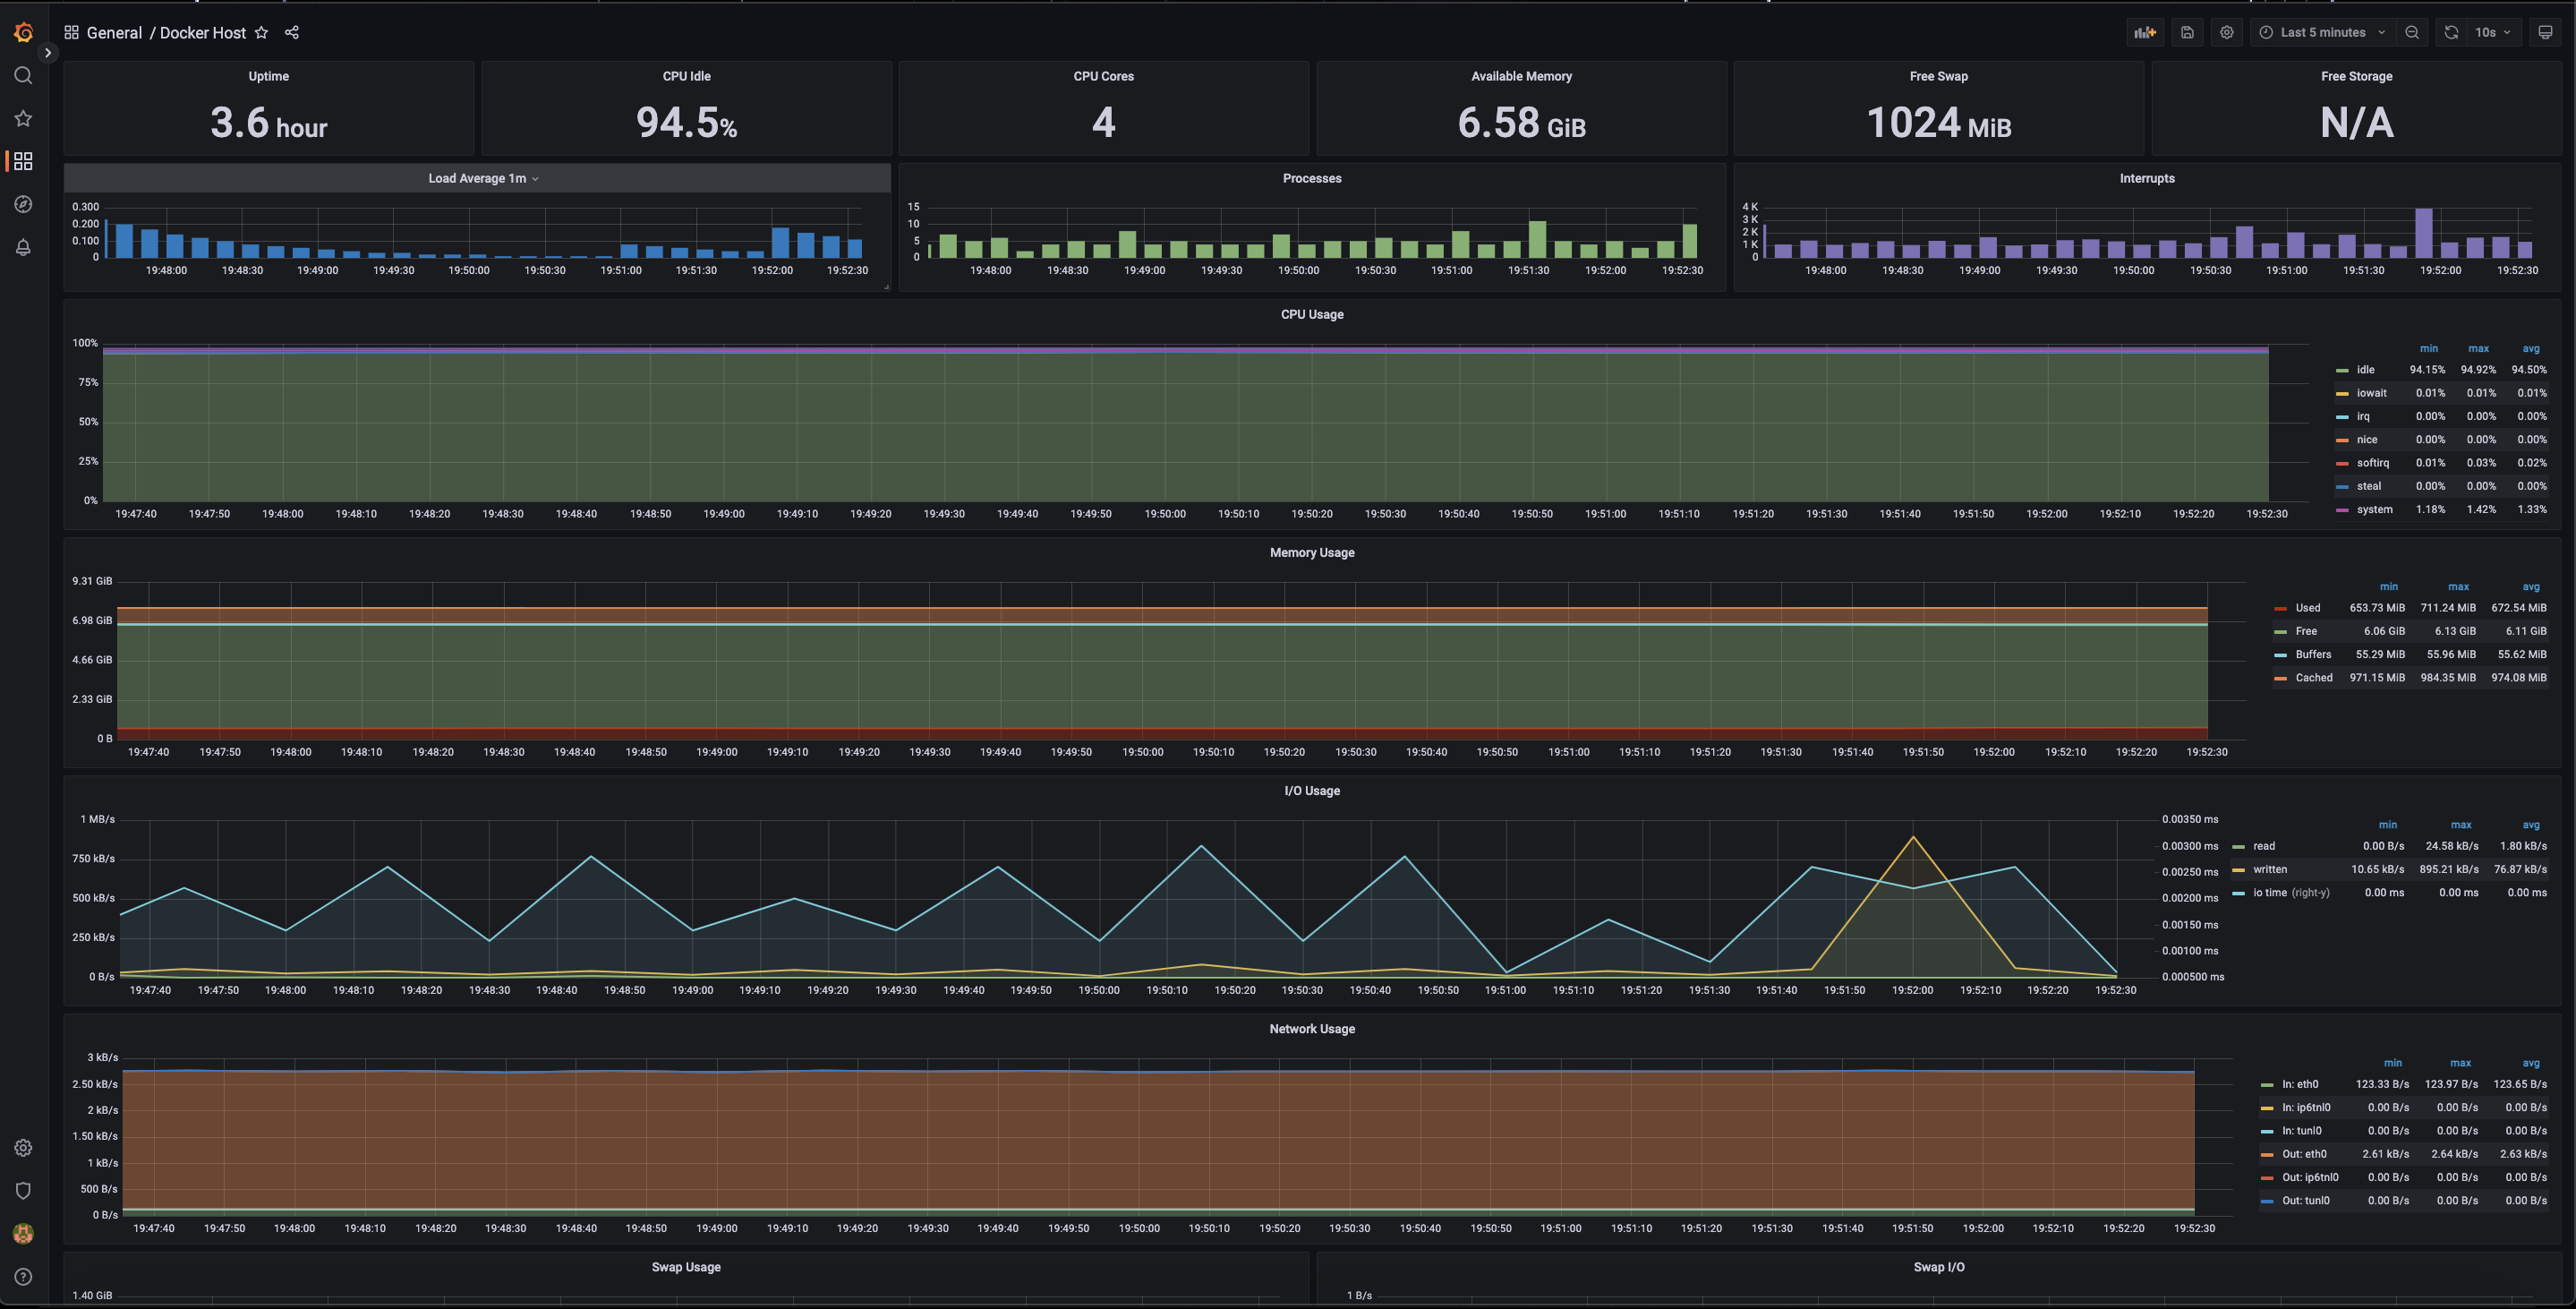
Trong phần này, mình có sử dụng 1 vài dashboards:
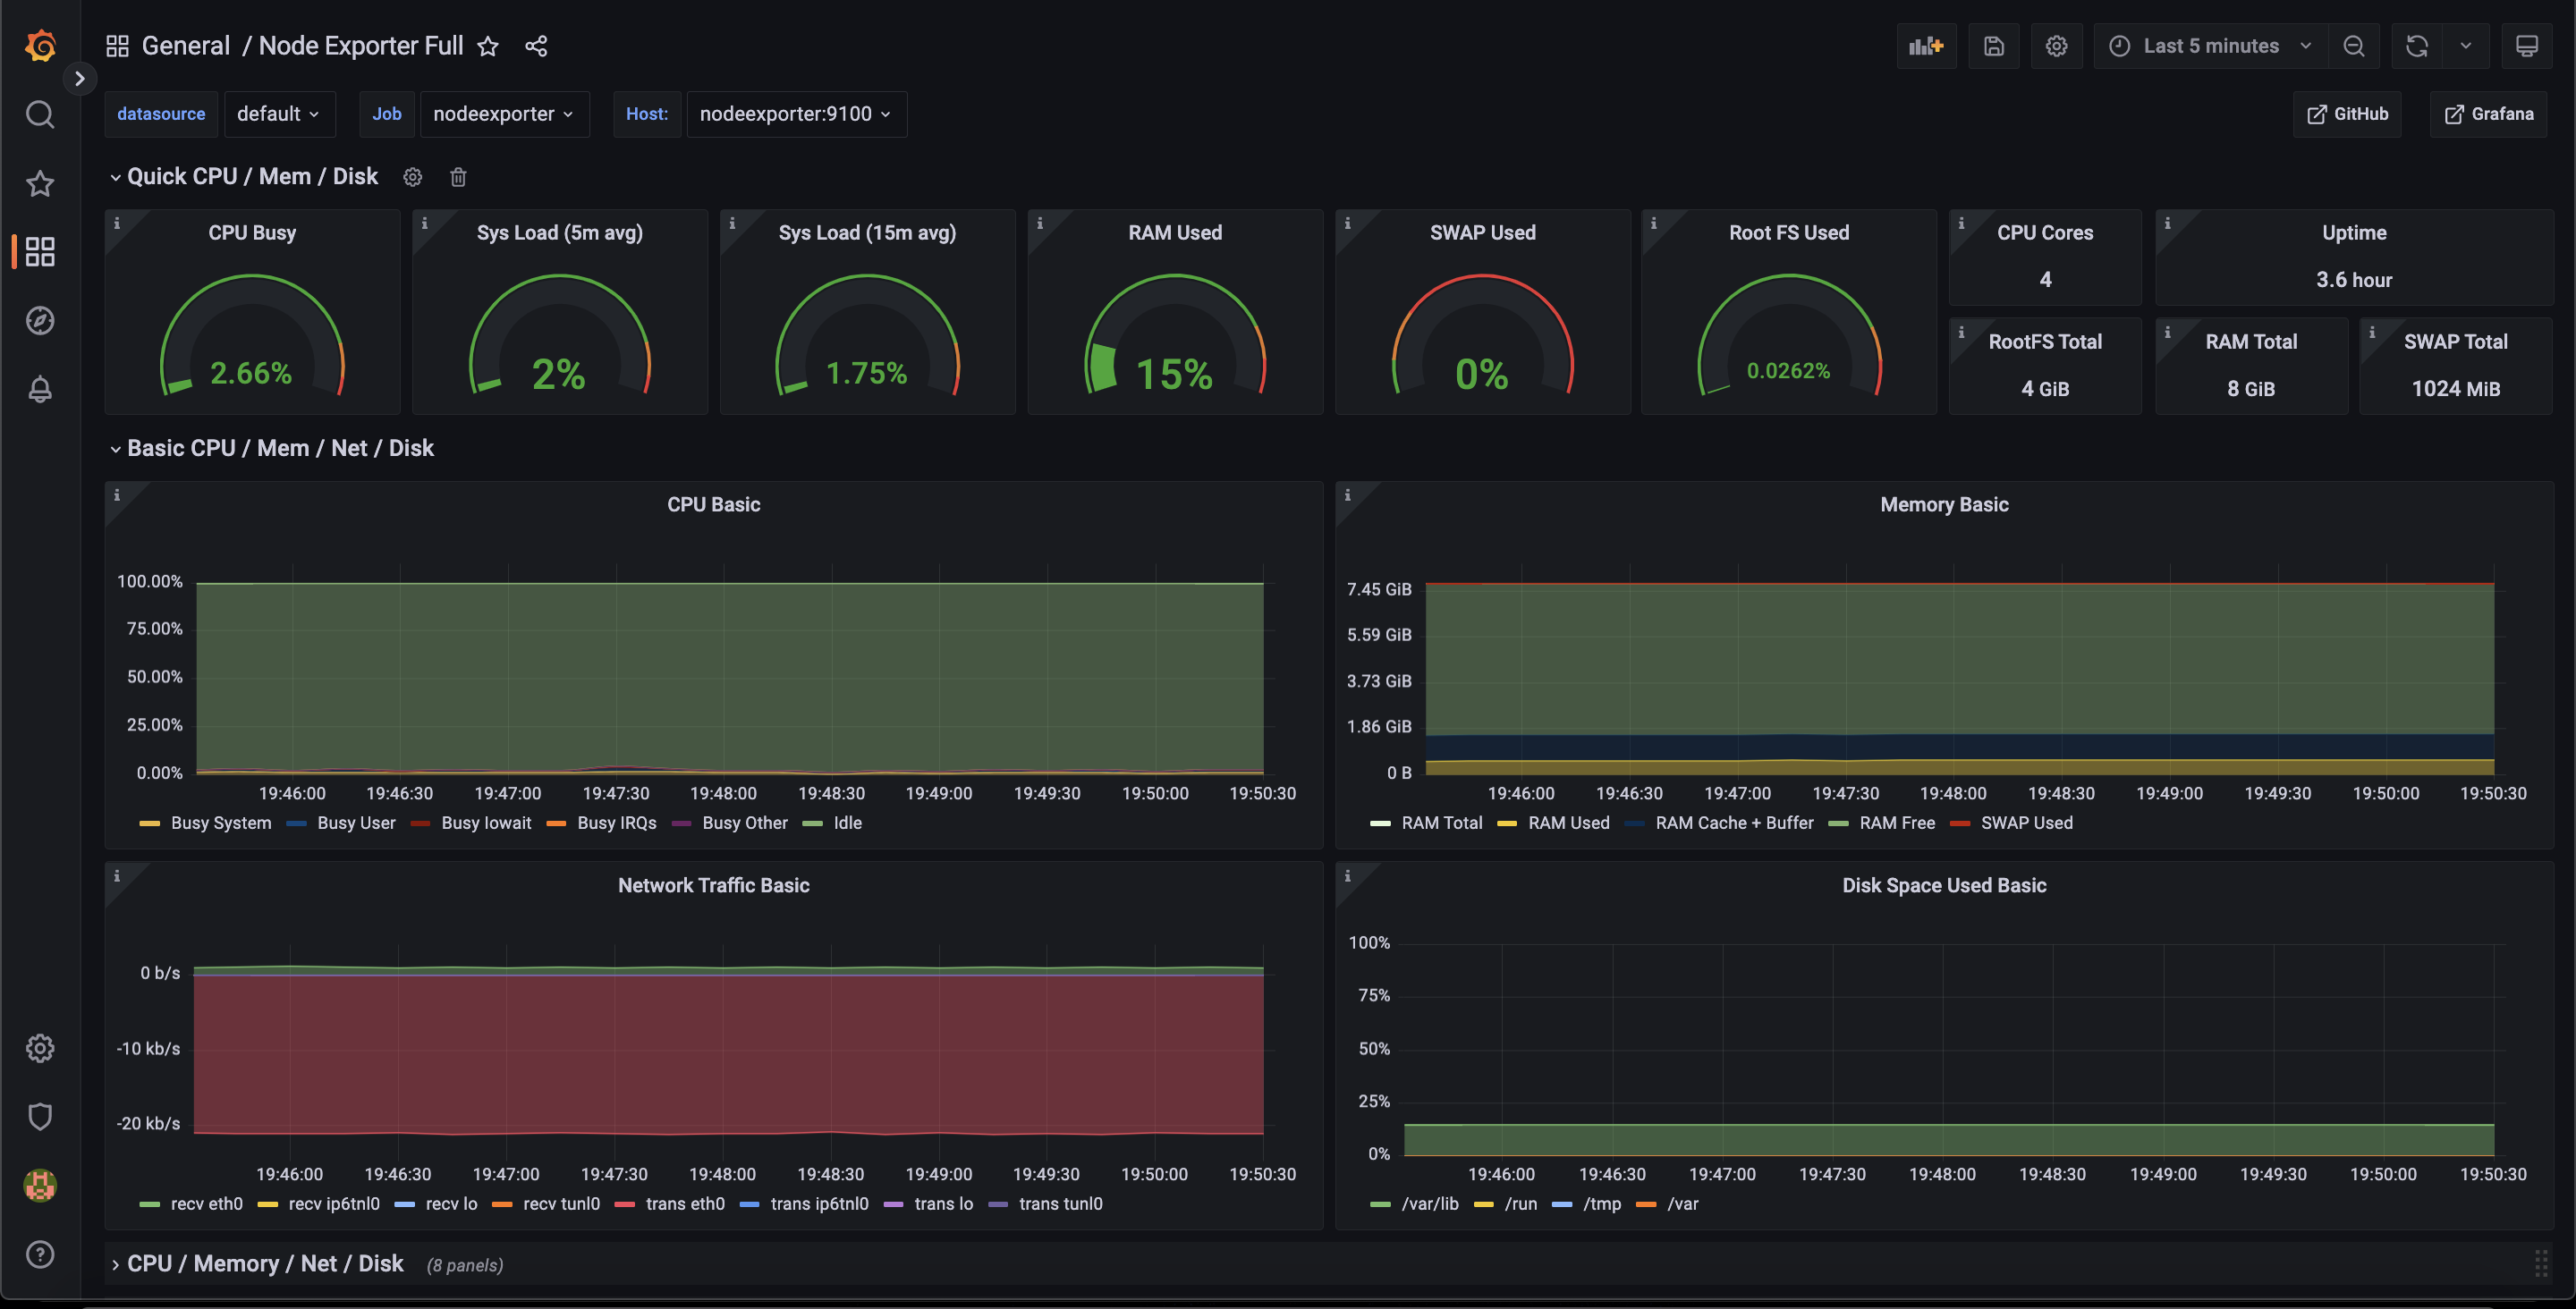
Monitor Services
Docker Host
Loki + Promtail
Loki được lấy cảm hứng từ prometheus, hệ thống thu thập, lưu trữ và phân tích logs. Chúng ta có thể dễ dàng truy vấn logs từ Loki và giới hạn dung lượng nhận logs và thời gian để xử lý các logs cũ. Anh em có thể tham khảo file config loki của mình tại đây. Hoặc vô thẳng trang github để xem :v
Promtail công cụ để lấy logs và gửi về cho Loki server. Trong domolo
mình sử dụng promtail để thực hiện thu thập logs của containers và hệ thống:
volumes: - /var/run/docker.sock:/var/run/docker.sock - /var/log:/var/log:ro
- Scape logs containers:
- job_name: container_logs docker_sd_configs: - host: unix:///var/run/docker.sock refresh_interval: 5s relabel_configs: - source_labels: ['__meta_docker_container_name'] regex: '/(.*)' target_label: 'container'
- Scrape logs systems:
- job_name: system static_configs: - targets: - localhost labels: job: varlogs __path__: /var/log/*log
Ok !!! Vậy là xong sương sương phần lý thuyết của 2 thằng Loki và promtail. Tiếp theo, mình sẽ dựng thử lên xem trông như nào.
Demo
Đầu tiên, mình tạo 1 cái tool nhỏ để tự động gen ra logs. Anh em có thể xem ở đây. Tool này mình viết bằng bash script chỉ đơn thuần là in ra vài messages linh tinh và màu mè :v
➜ domolo git:(master) cd fake-logs
➜ fake-logs git:(master) ✗ chmod +x entrypoint.sh
➜ fake-logs git:(master) ✗ ./entrypoint.sh
2022-12-08T13:20:00Z ERROR An error is usually an exception that has been caught and not handled.
2022-12-08T13:20:00Z DEBUG This is a debug log that shows a log that can be ignored.
2022-12-08T13:20:01Z WARN A warning that should be ignored is usually at this level and should be actionable.
2022-12-08T13:20:03Z ERROR An error is usually an exception that has been caught and not handled.
2022-12-08T13:20:05Z ERROR An error is usually an exception that has been caught and not handled.
2022-12-08T13:20:09Z INFO This is less important than debug log and is often used to provide context in the current task.
2022-12-08T13:20:13Z ERROR An error is usually an exception that has been caught and not handled.
2022-12-08T13:20:15Z DEBUG This is a debug log that shows a log that can be ignored.
2022-12-08T13:20:16Z INFO This is less important than debug log and is often used to provide context in the current task.
2022-12-08T13:20:17Z INFO This is less important than debug log and is often used to provide context in the current task.
...
Sau đó, mình đóng nó thành Dockerfile và thêm trong file docker-compose hoặc là anh em có thể sự dụng file docker-compose.with-flogs.yml xong tiến hành build ...
docker-compose -f docker-compose.with-flogs.yml up -d
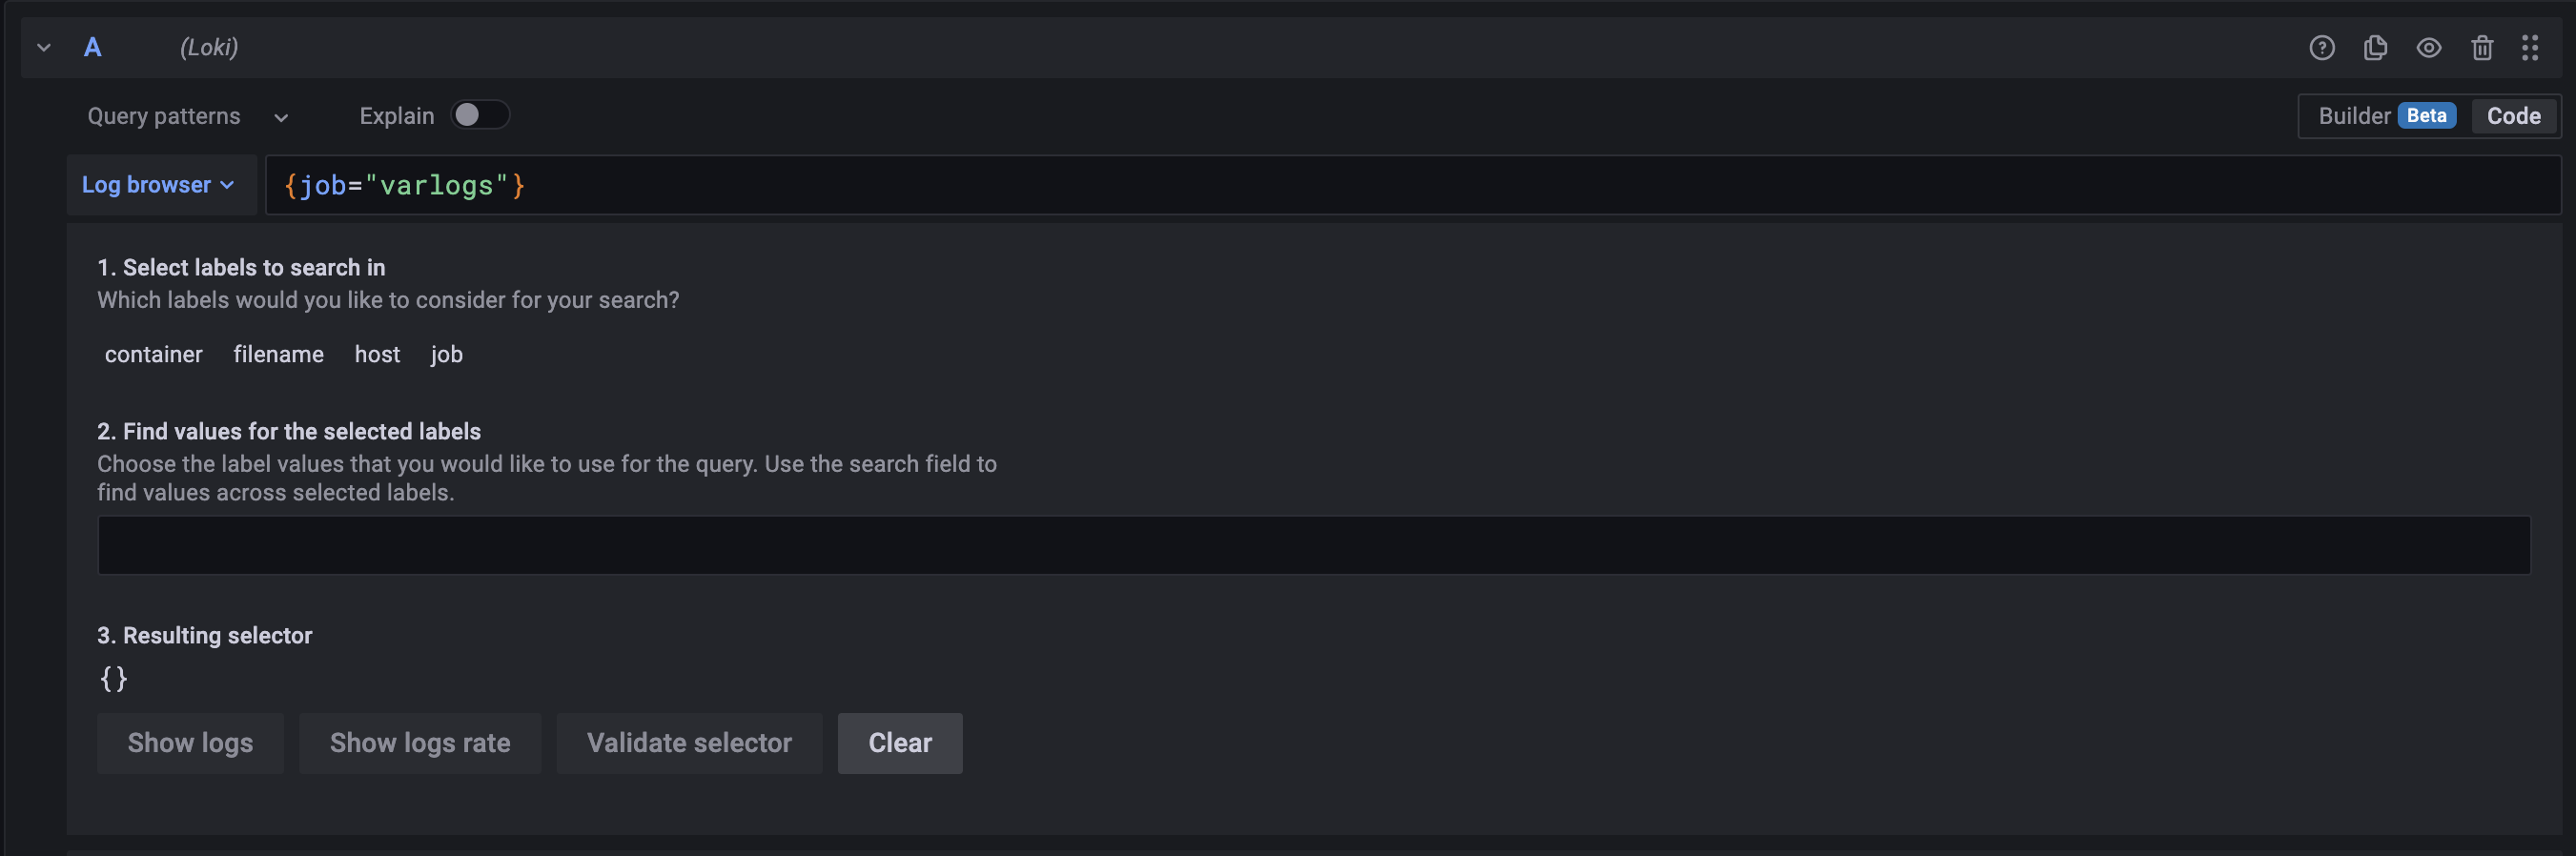
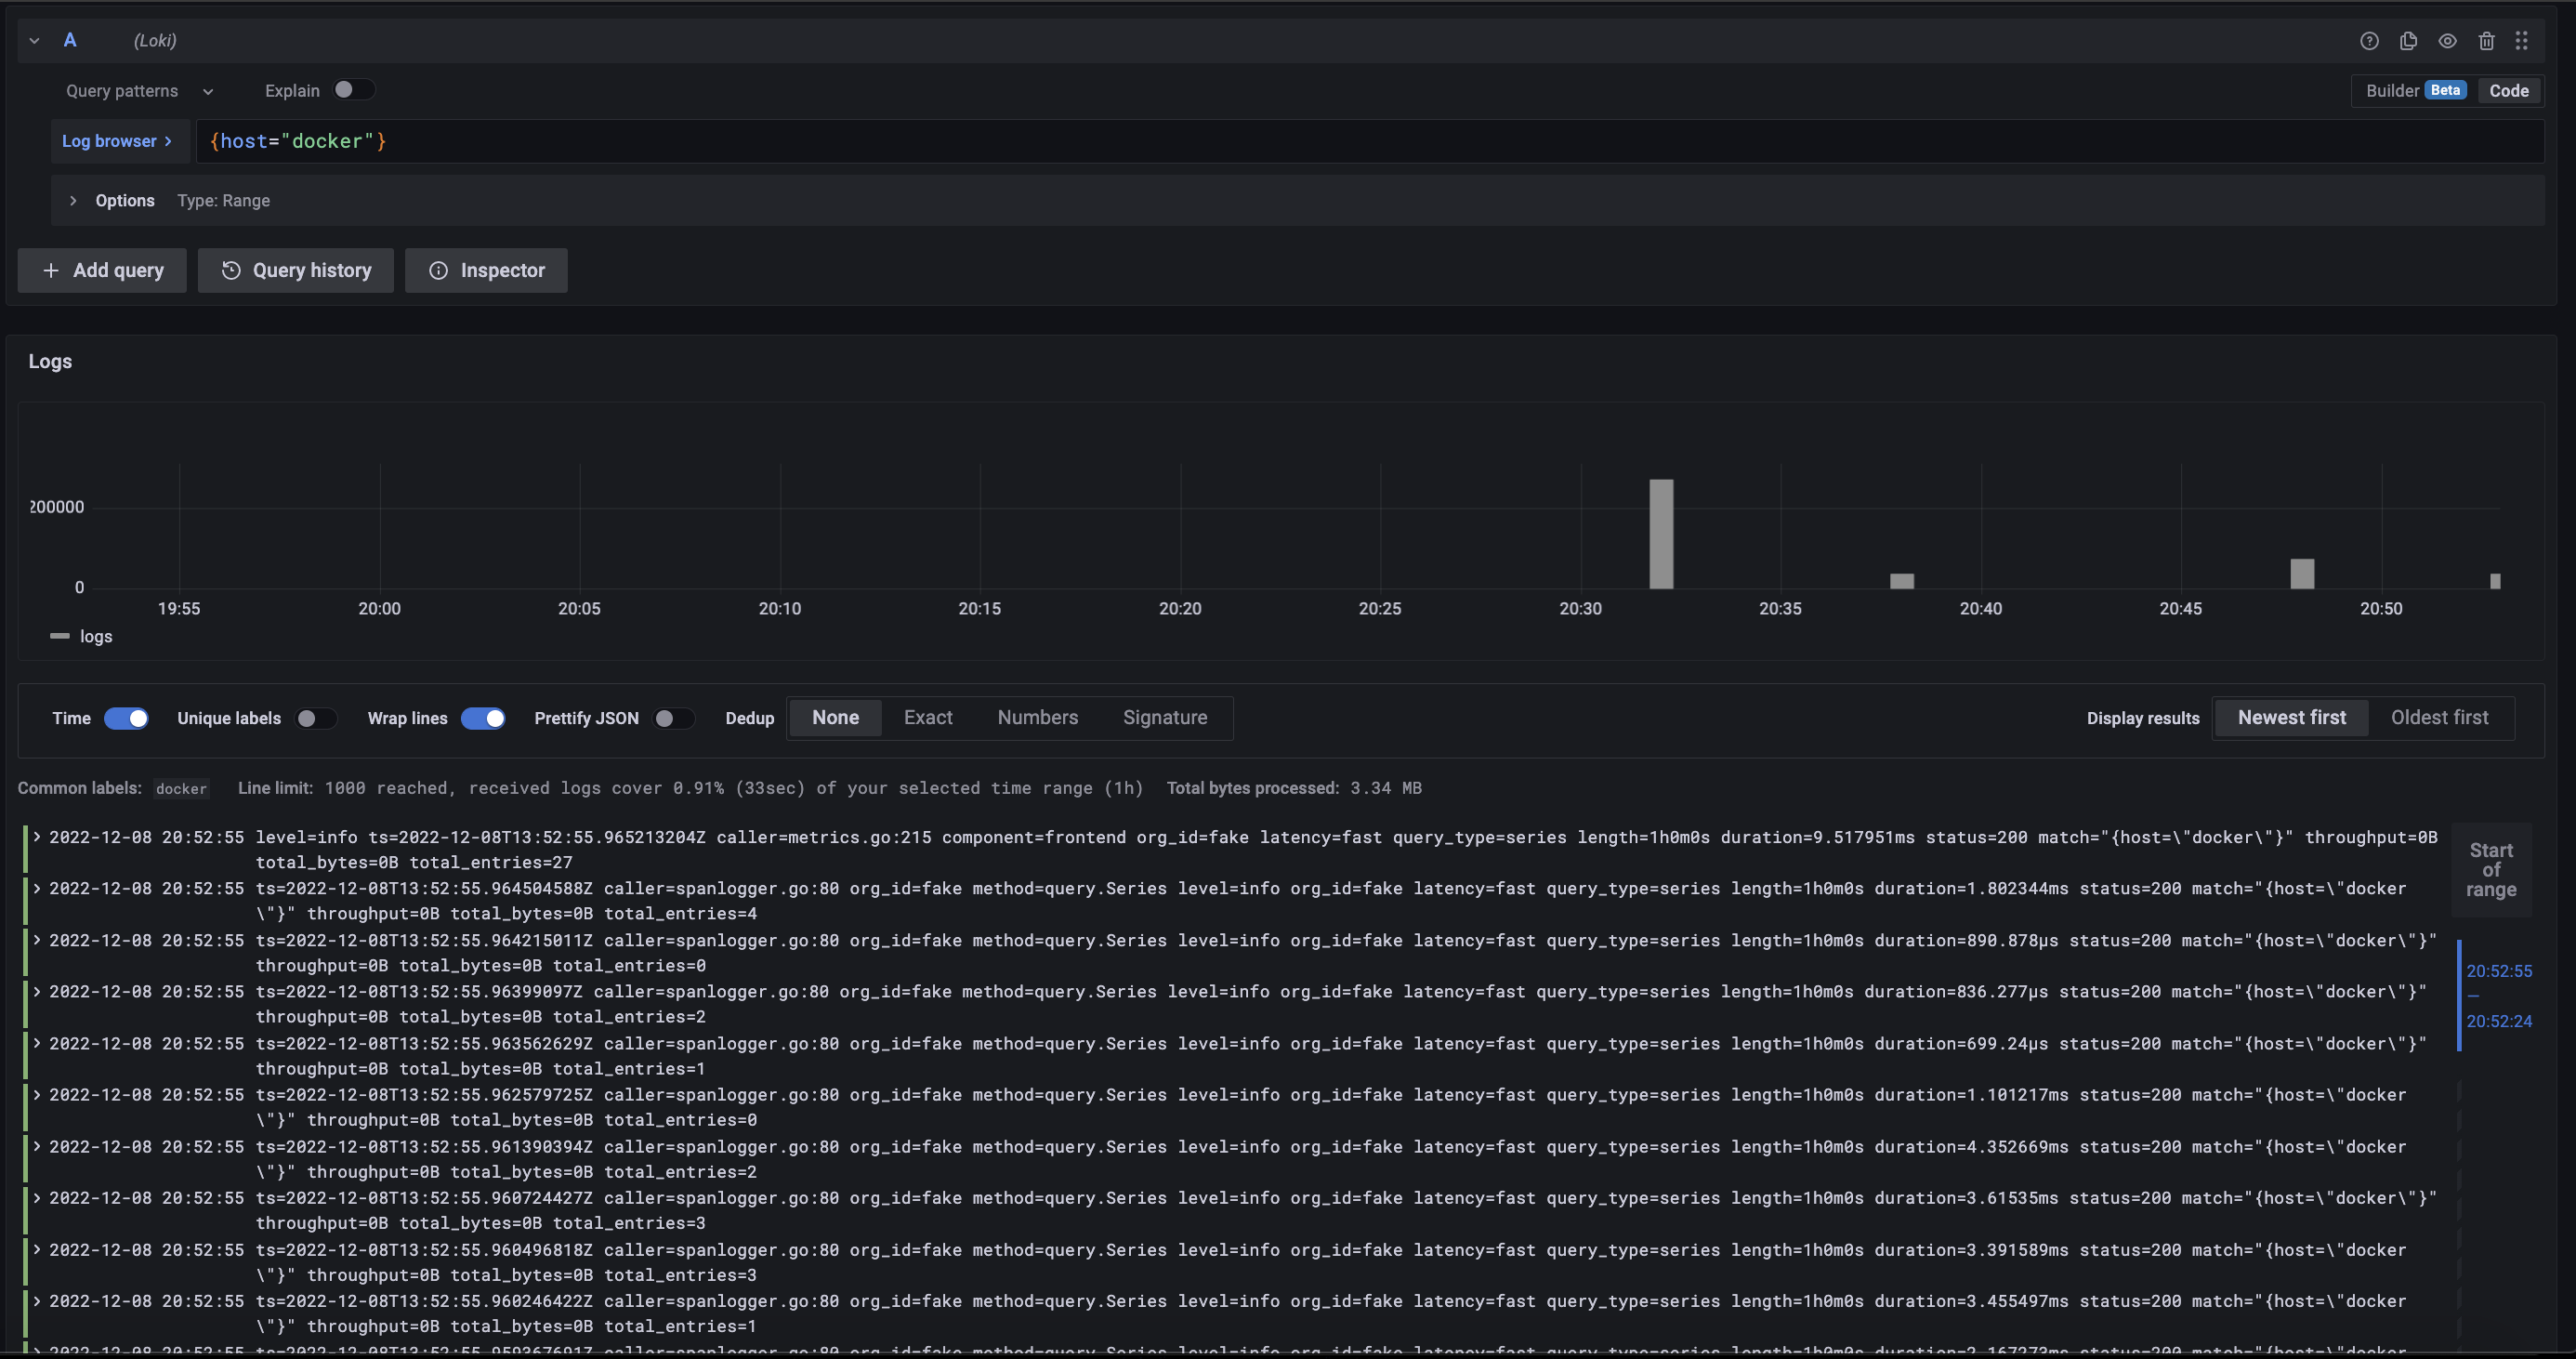
Xong rồi truy cập vào grafana và chọn Explore:
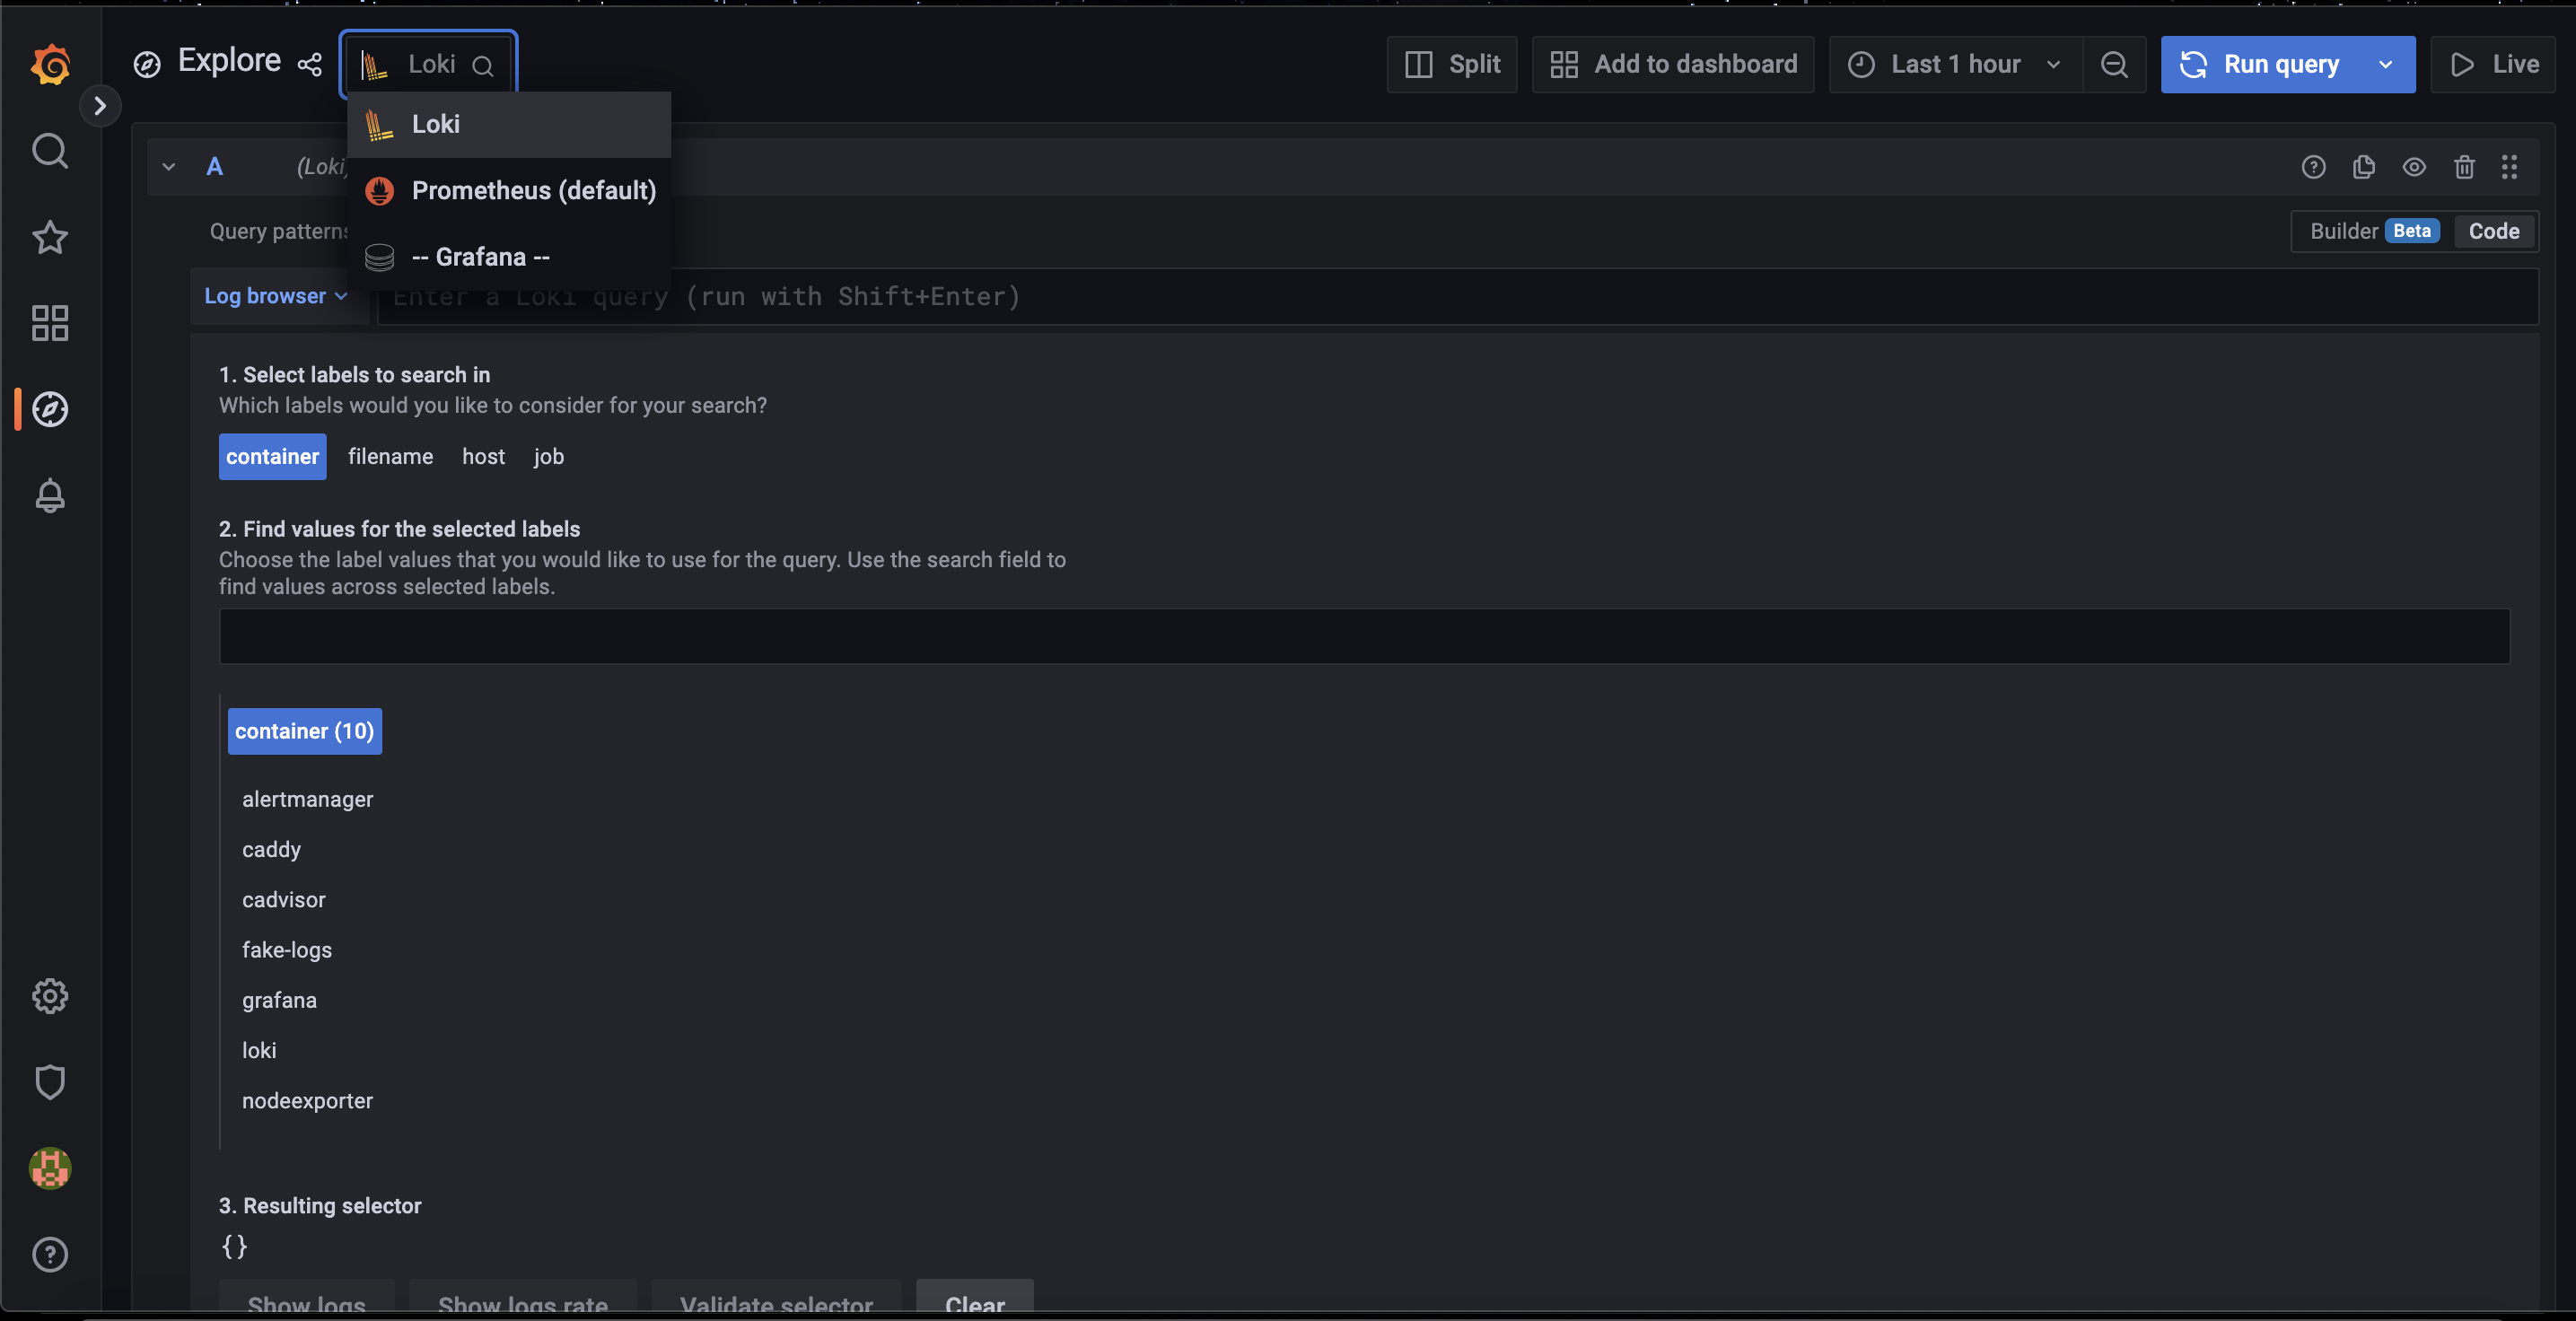
Tiếp theo, chọn labels để xem logs:
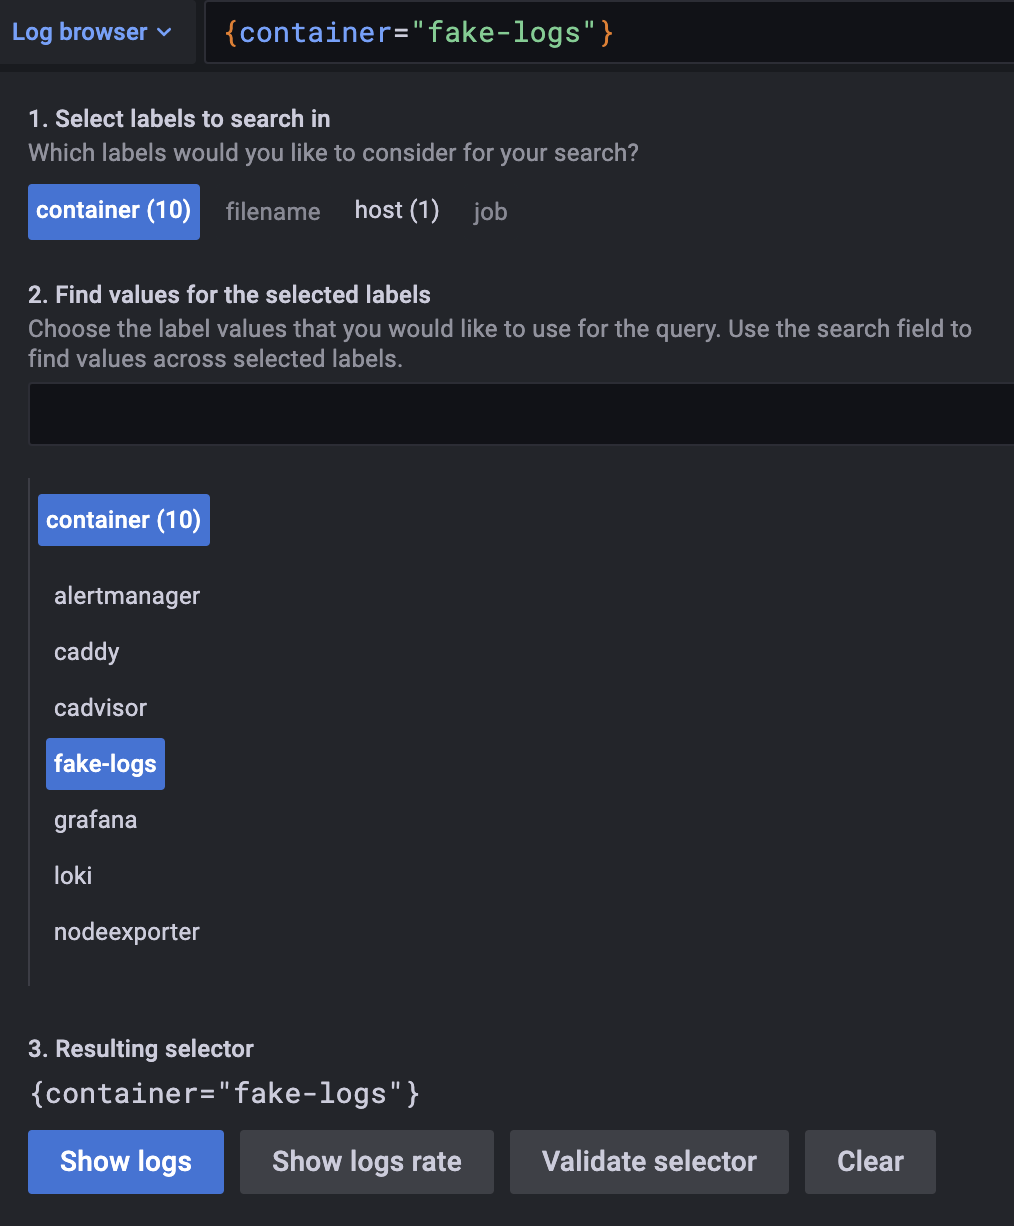
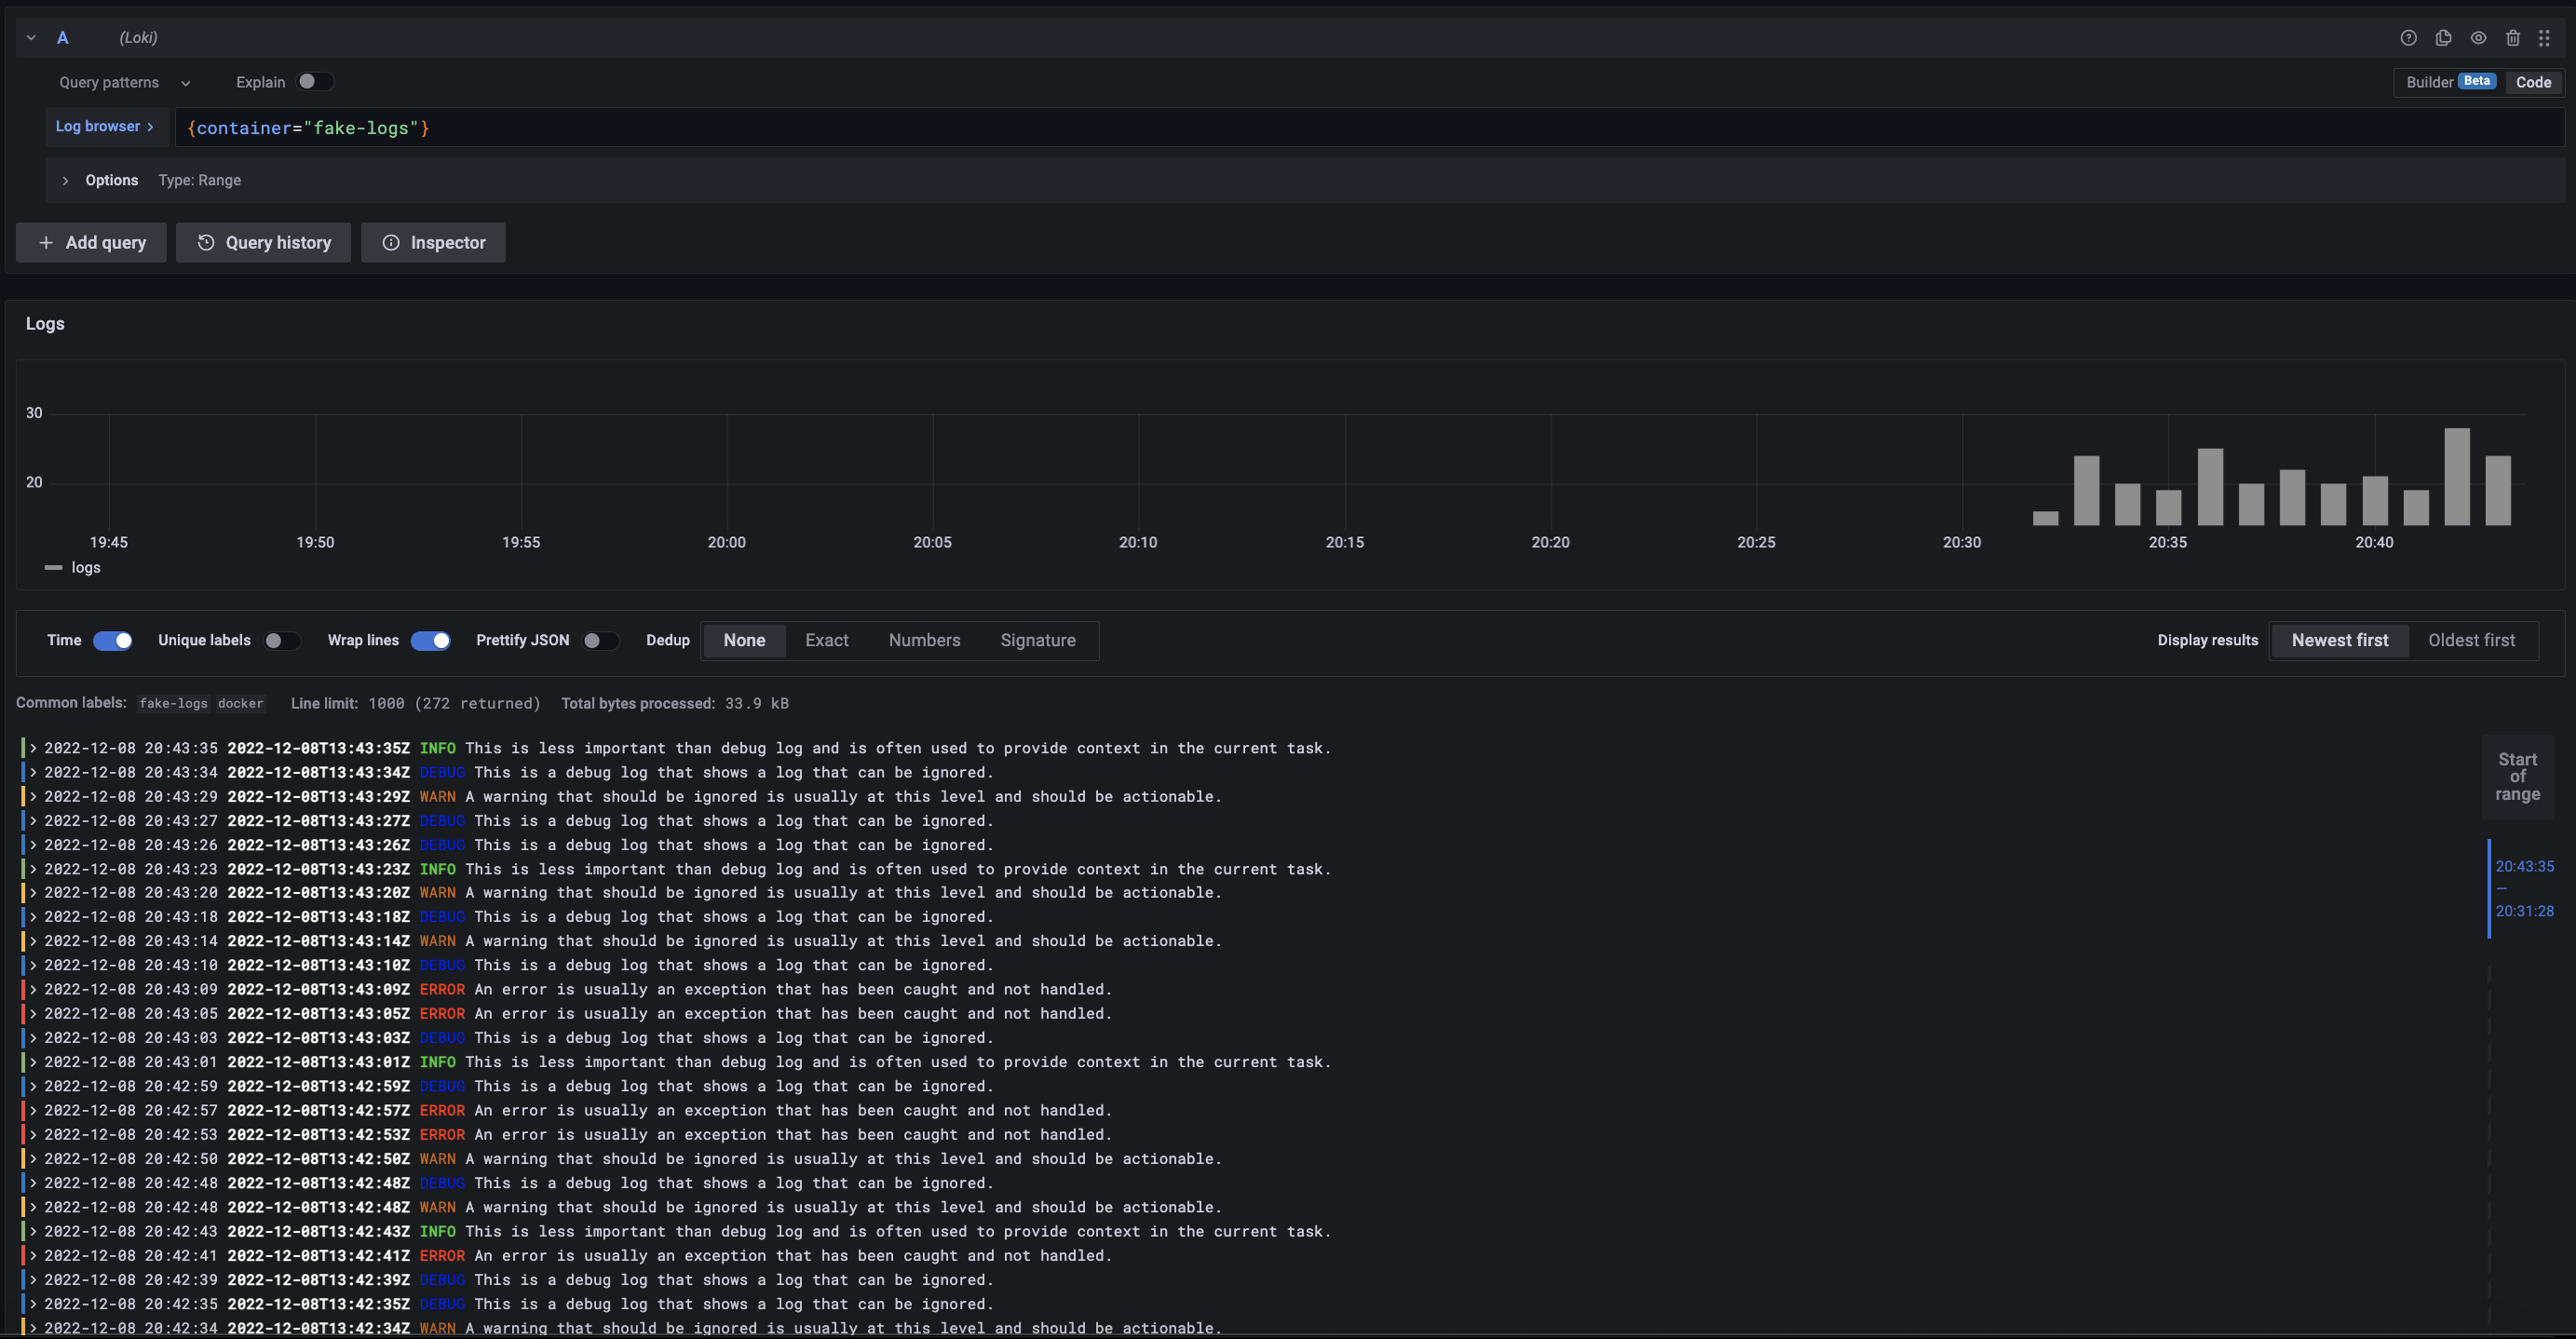
Ex: Chọn label container và xem log container fake-logs mới tạo:
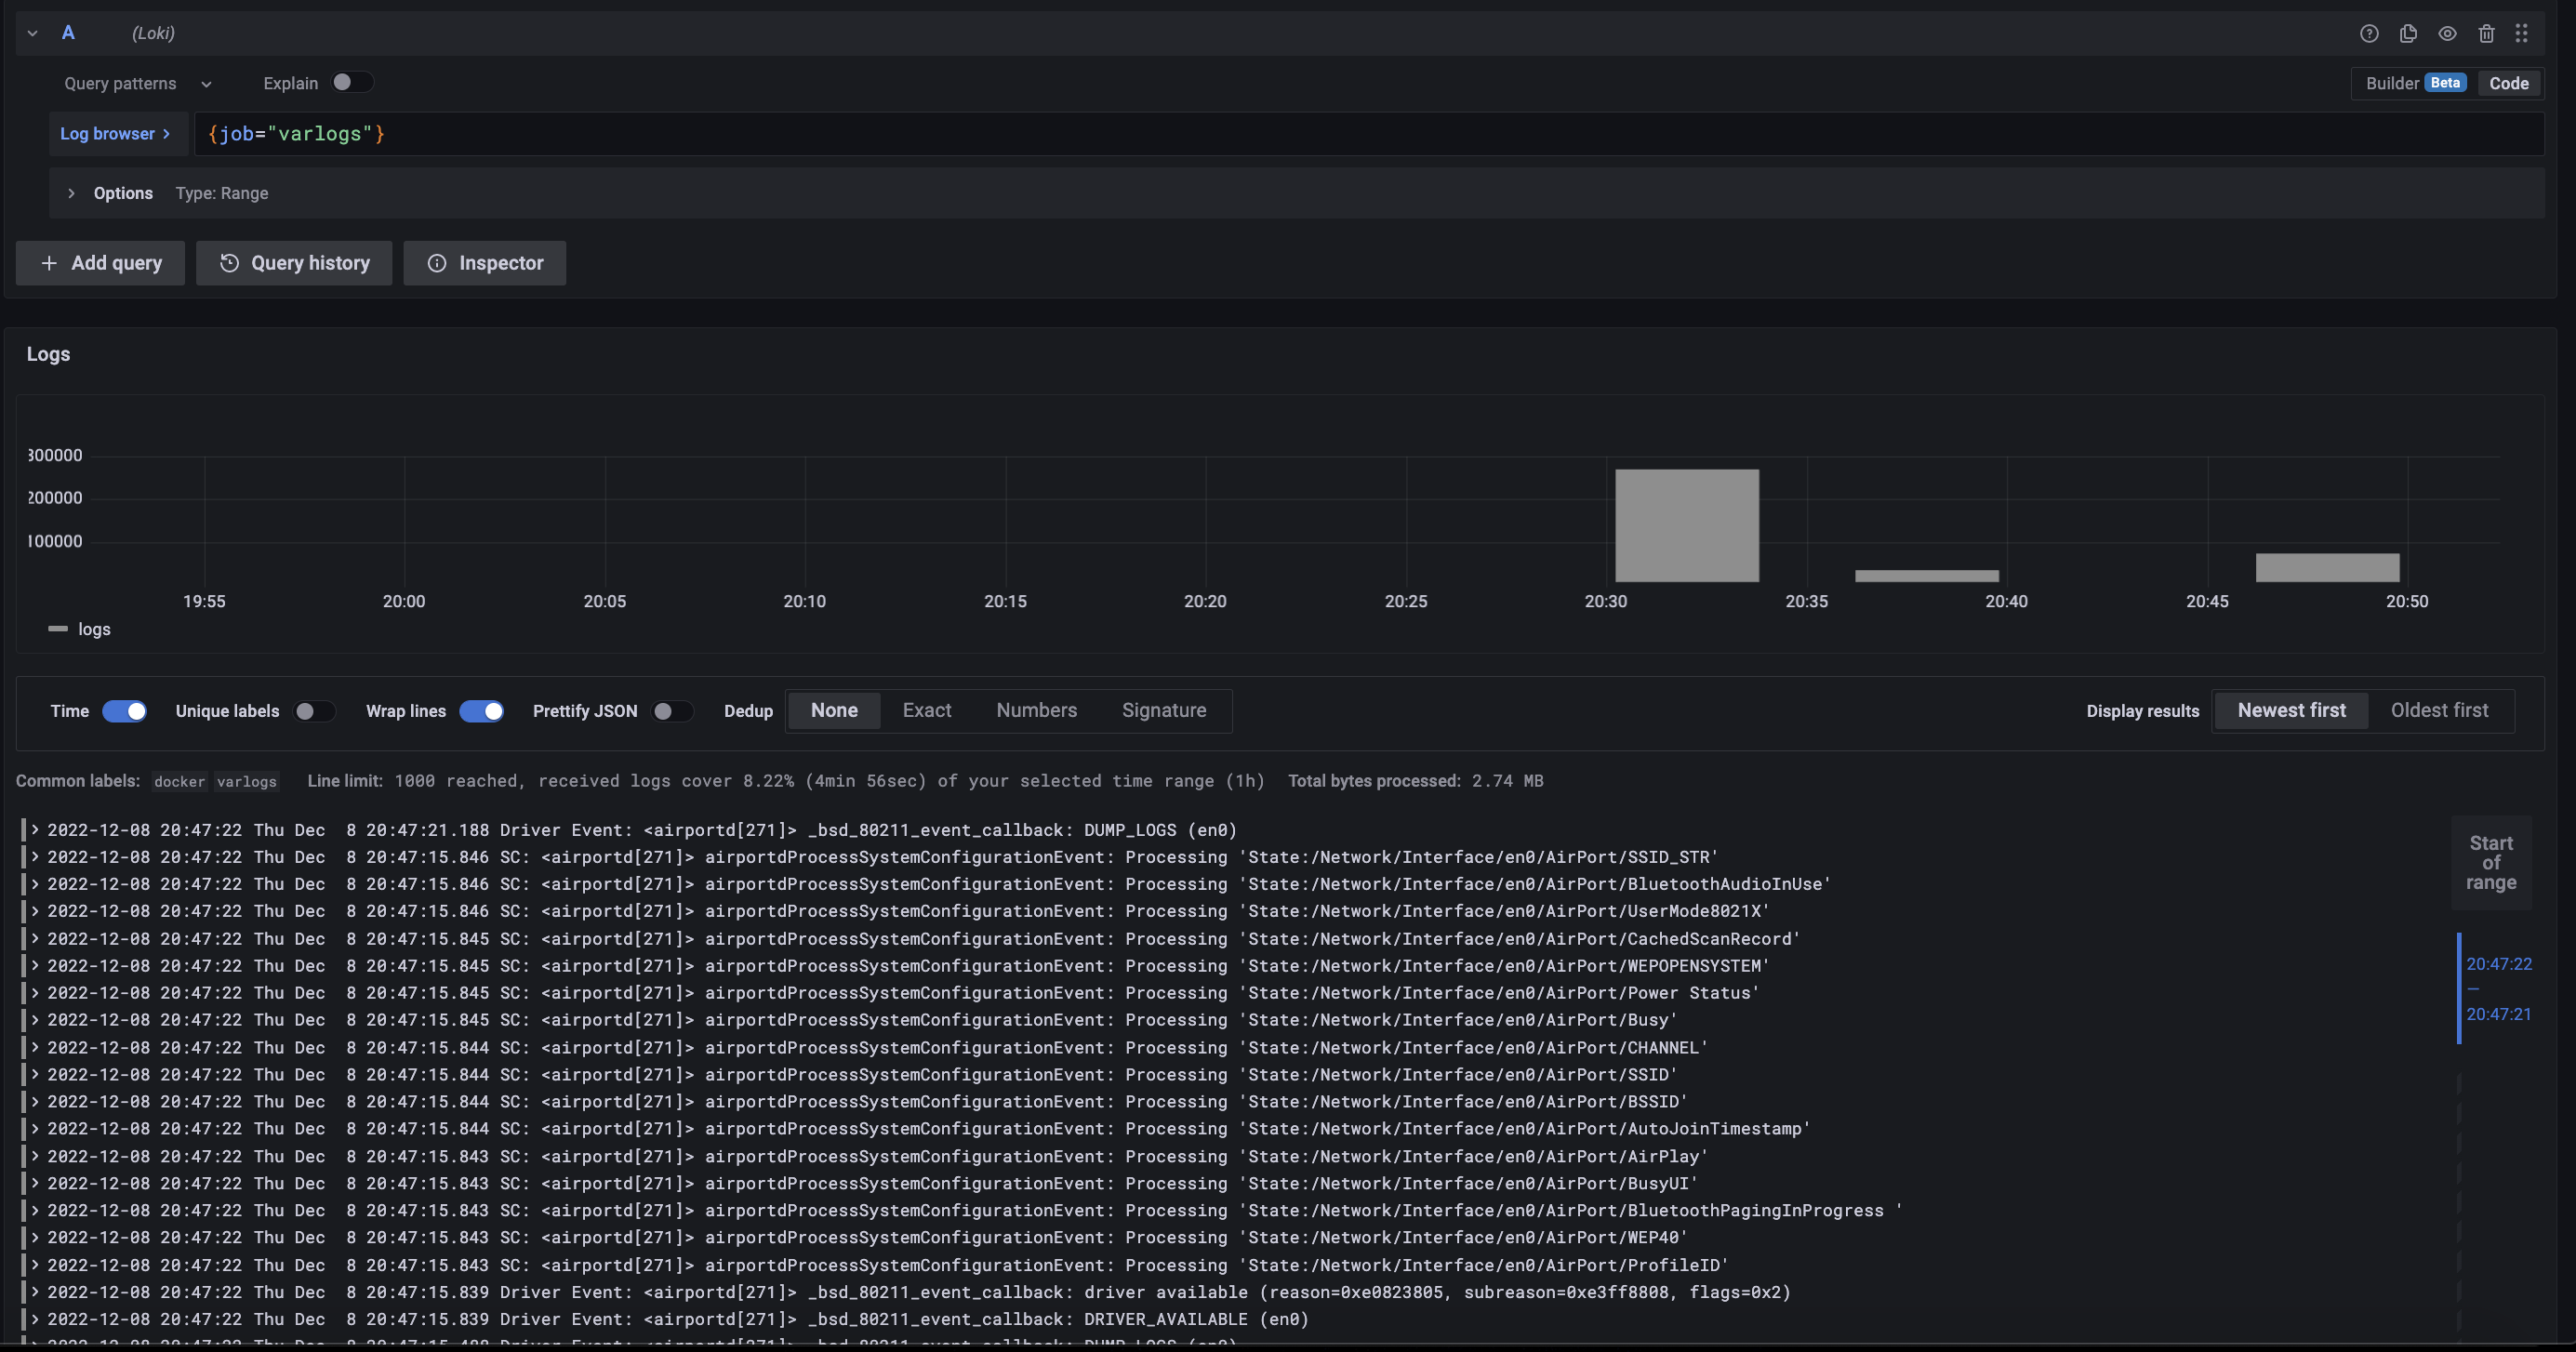
More logs: logs system, other containers, ....
Trông cũng ổn ổn đấy nhỷ :v

Kết
Vậy là mình vừa trình bày cách mình setup 1 hệ thống monitoring và logging. Nếu có gì sai sót hoặc trình bày chưa tốt anh em góp ý thêm cho mình nhé 🥳 🥳 🥳.
Cảm ơn anh em đã đọc !!!